FIGURE 8.

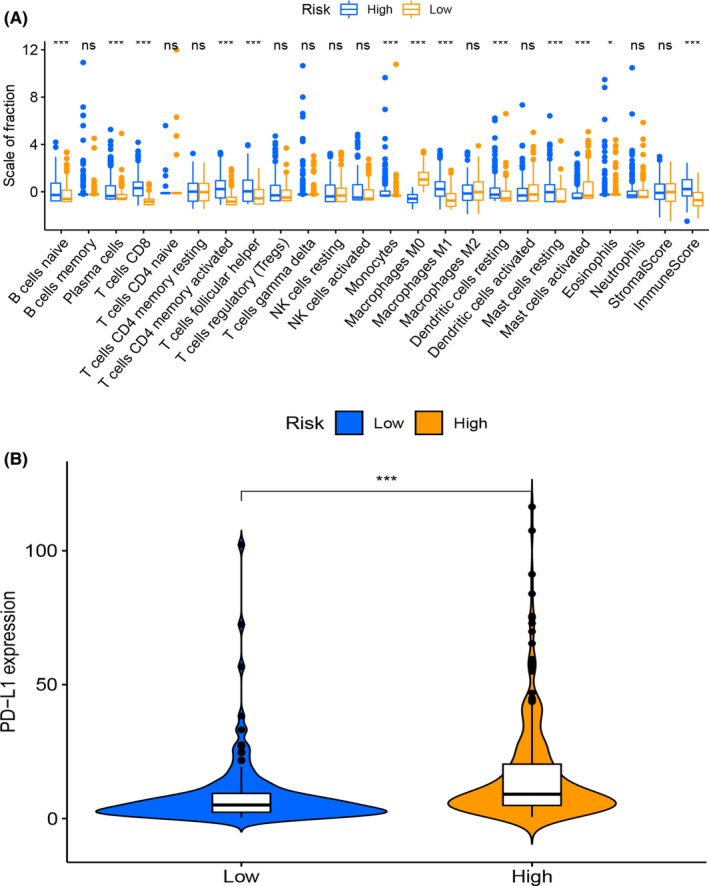
Analysis of immune cell infiltration in low‐ and high‐risk groups. (A) Boxplot for immune cells comparisons between low‐ and high‐risk subgroups. (B) Violin plot for PD‐L1 expression between low‐ and high‐risk subgroups

Analysis of immune cell infiltration in low‐ and high‐risk groups. (A) Boxplot for immune cells comparisons between low‐ and high‐risk subgroups. (B) Violin plot for PD‐L1 expression between low‐ and high‐risk subgroups