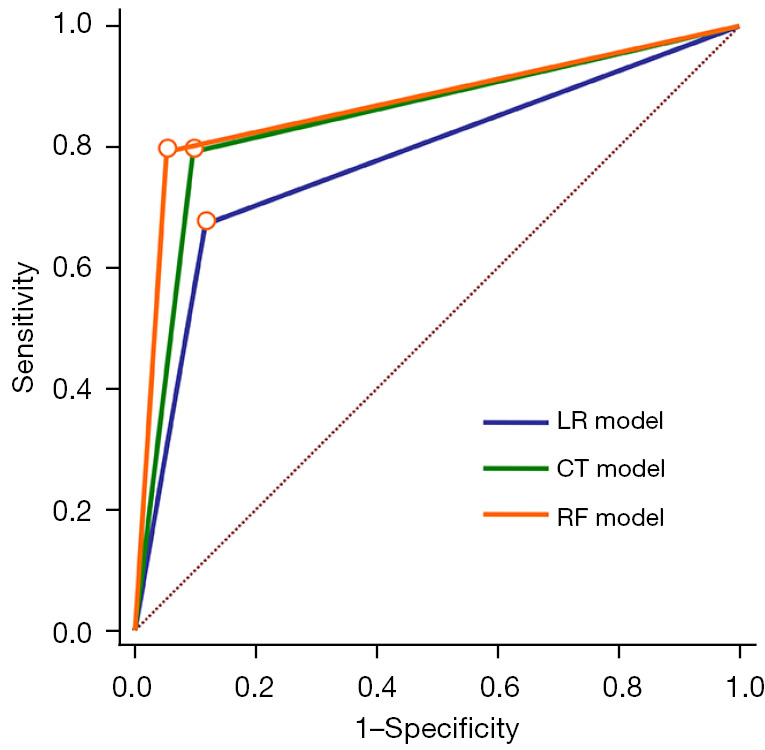
Figure 3.

AUC of different models based on the testing set. Logistic regression model (AUC =0.778; 95% CI: 0.719 to 0.829); classification tree model (AUC =0.850: 95% CI: 0.798 to 0.893); random forests model (AUC =0.871; 95% CI: 0.822-0.911). AUC, area under the ROC curve; ROC, receiver operating characteristic; LR, logistic regression; CT, classification tree; RF, random forest.
