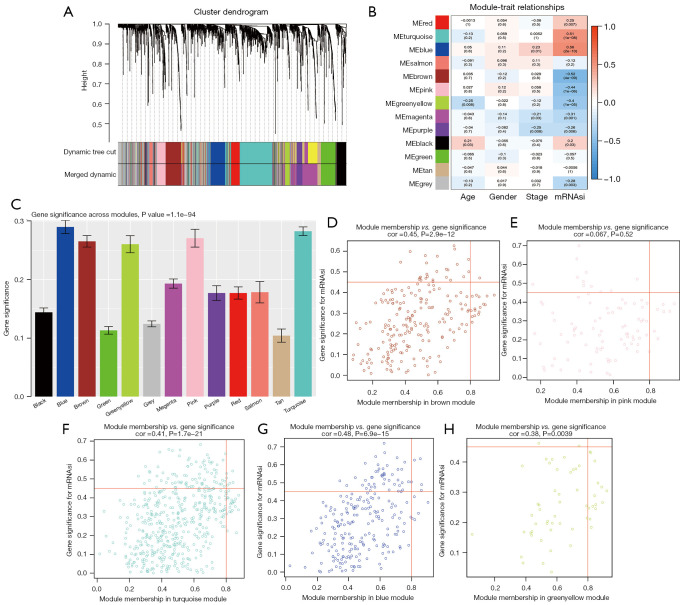
Figure 3.
Weighted gene co-expression network analysis. (A) Identification of a co-expression module in WT. The branches of the cluster dendrogram correspond to the 12 different gene modules. Each piece of the leaves on the cluster dendrogram corresponds to a gene. (B) Correlation between the gene module and clinical traits, including the mRNAsi and other clinical features. The correlation coefficient in each cell represents the correlation between the gene module and clinical characteristics, which decreases in size from red to blue. The corresponding P value is also annotated. (C) Histogram indicating the absolute value of GS for each module. (D-H) Scatter plot of module eigengenes in the brown, pink, turquoise, blue, green-yellow modules. WT, Wilms’ tumor; GS, gene significance.

