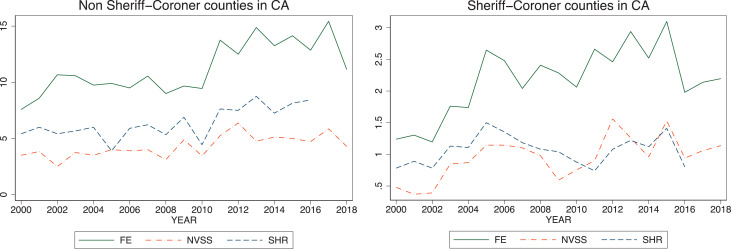
Figure 1:
Average number of officer-involved homicides by sheriff-coroner status. The figures indicate the average number of officer-involved homicides per county per year in each of the three data sets: FE, NVSS, and SHR, for California’s 58 counties. The left panel corresponds to the counties without sheriff-coroner and the right panel to the counties with sheriff-coroner in each year. FE indicates Fatal Encounters; NVSS, National Vital Statistics System; SHR, Supplementary Homicides Report.

