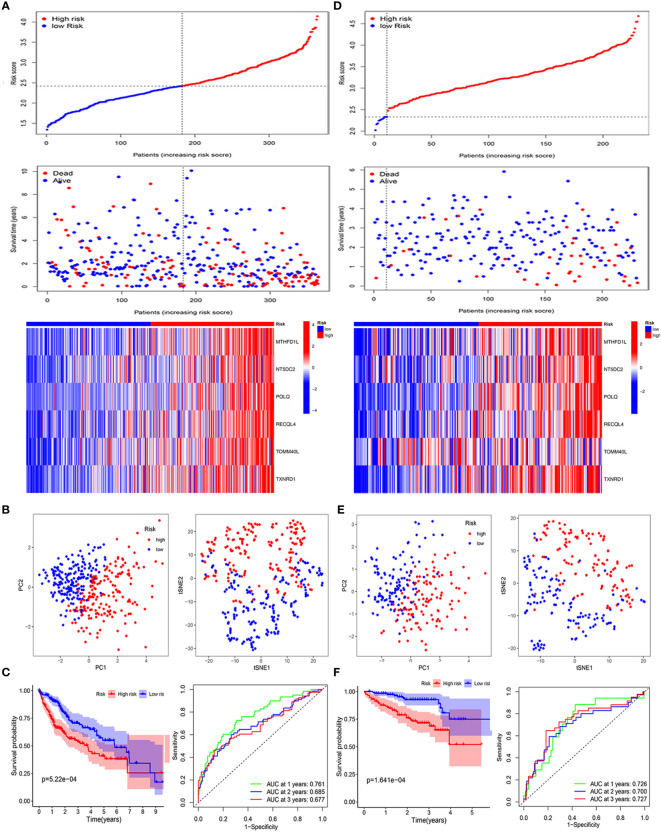
Figure 2.
Validation of the six mitochondria-related prognostic signatures in the TCGA and ICGC cohorts. TCGA cohort: (A–C); ICGC cohort: (D–F). (A–D) Risk score values and distribution, OS status and heatmap analysis of the 6-gene signature model. (B, E) The PCA plots and t-SNE analysis of risk scores. (C, F) Kaplan–Meier curves and AUC time-dependent ROC curves for OS.

