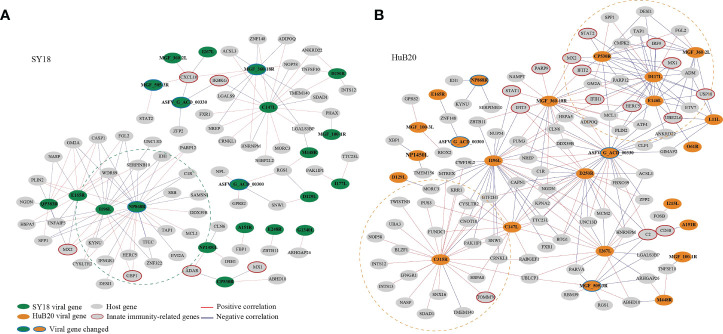
Figure 7.
The correlation between the ASFV and host DEGs was measured using Pearson correlation coefficients for the corresponding gene expression and is visualized in the network for SY18 (A) and HuB20 (B) strains. The absolute value of the Pearson correlation coefficient > 0.9 was considered significant. Red and blue lines indicate positive and negative correlations, respectively.

