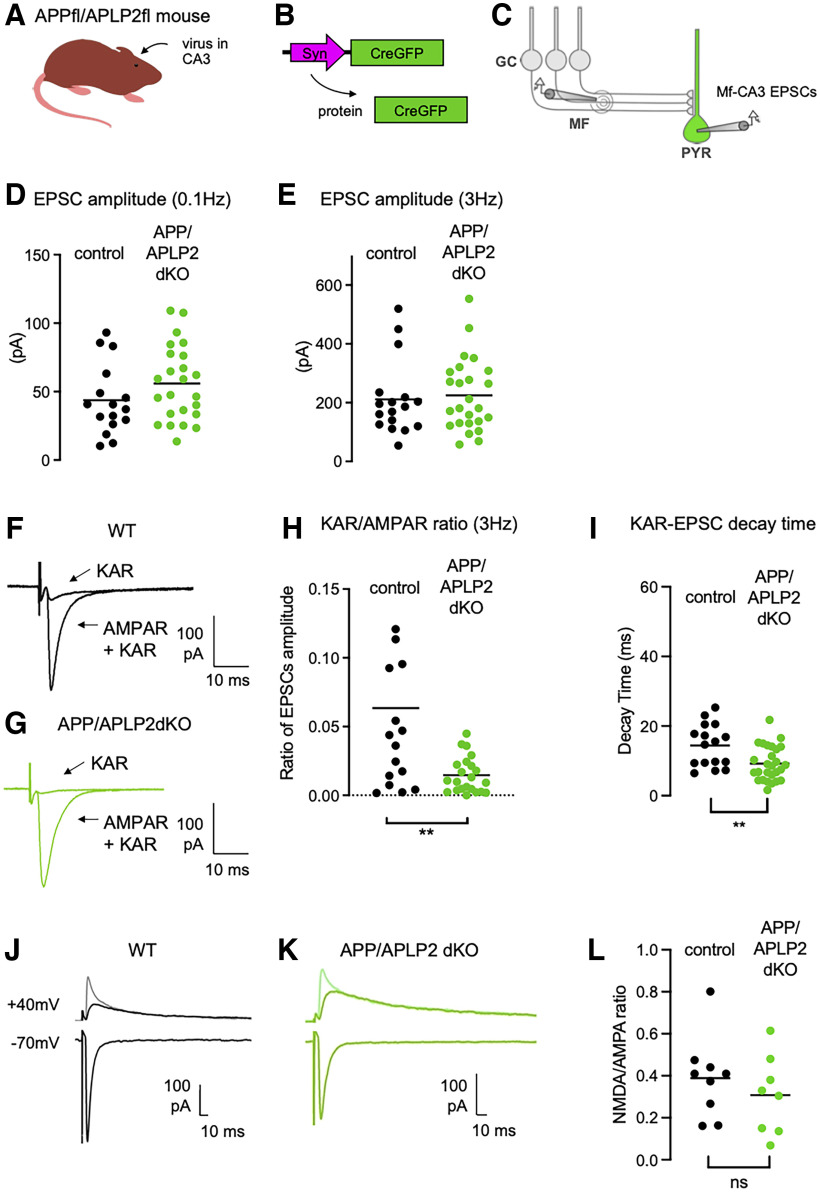
Figure 5.
Impaired synaptic expression and function of KARs in the absence of APP. A, Cartoon representing the APP/APLP2 floxed mouse model. Cre recombinase-expressing viruses are injected into the CA3 region by stereotaxic surgery. B, Scheme representing the viral vector to express Cre fused to GFP in CA3 pyramidal neurons. C, Scheme representing the stimulation of Mf that evokes EPSCs recorded in CA3 pyramidal neurons (PYR) genetically manipulated (Cre-mediated APP/APLP2 genes deletion) and identified with GFP. D, E, Scatter plots with averages of the EPSC amplitude recorded at 0.1 Hz (D) or 3 Hz (E) demonstrate that basal synaptic transmission (at 0.1 Hz) and frequency facilitation is not altered in postsynaptic APP/APLP2 KO condition. F, G, Representative traces of EPSCs recorded at 3 Hz in WT mice (F) or in postsynaptic APP/APLP2 KO mice (G) under conditions where both AMPAR and KAR currents are active or when KAR currents have been pharmacologically isolated. H, Amplitude of KAR-EPSCs normalized to AMPAR-EPSCs recorded at 3 Hz. The relative amplitude of KAR-EPSCs is significantly lower in postsynaptic APP/APLP2 KO condition. I, Average decay times of KAR-EPSCs are markedly decreased in APP/APLP2 KO conditions. **p < 0.01. J, K, Representative traces of Mf-EPSCs recorded at negative (−70 mV) and positive holding potentials (+40 mV), without (lighter color trace) and with NBQX (20 μm) to isolate NMDAR-mediated currents. Bicuculline (10 μm) was present throughout all the recordings. L, Mean values of NMDAR/AMPAR ratios at a frequency of stimulation of 0.1 Hz, calculated from the peak amplitude of AMPAR-EPSCs recorded at –70 mV and the peak amplitude of NMDAR-EPSCs at +40 mV (without NBQX). The ratio is not altered in APP/APLP2 dKO conditions (n = 8–9 cells, p = 0.3943).

