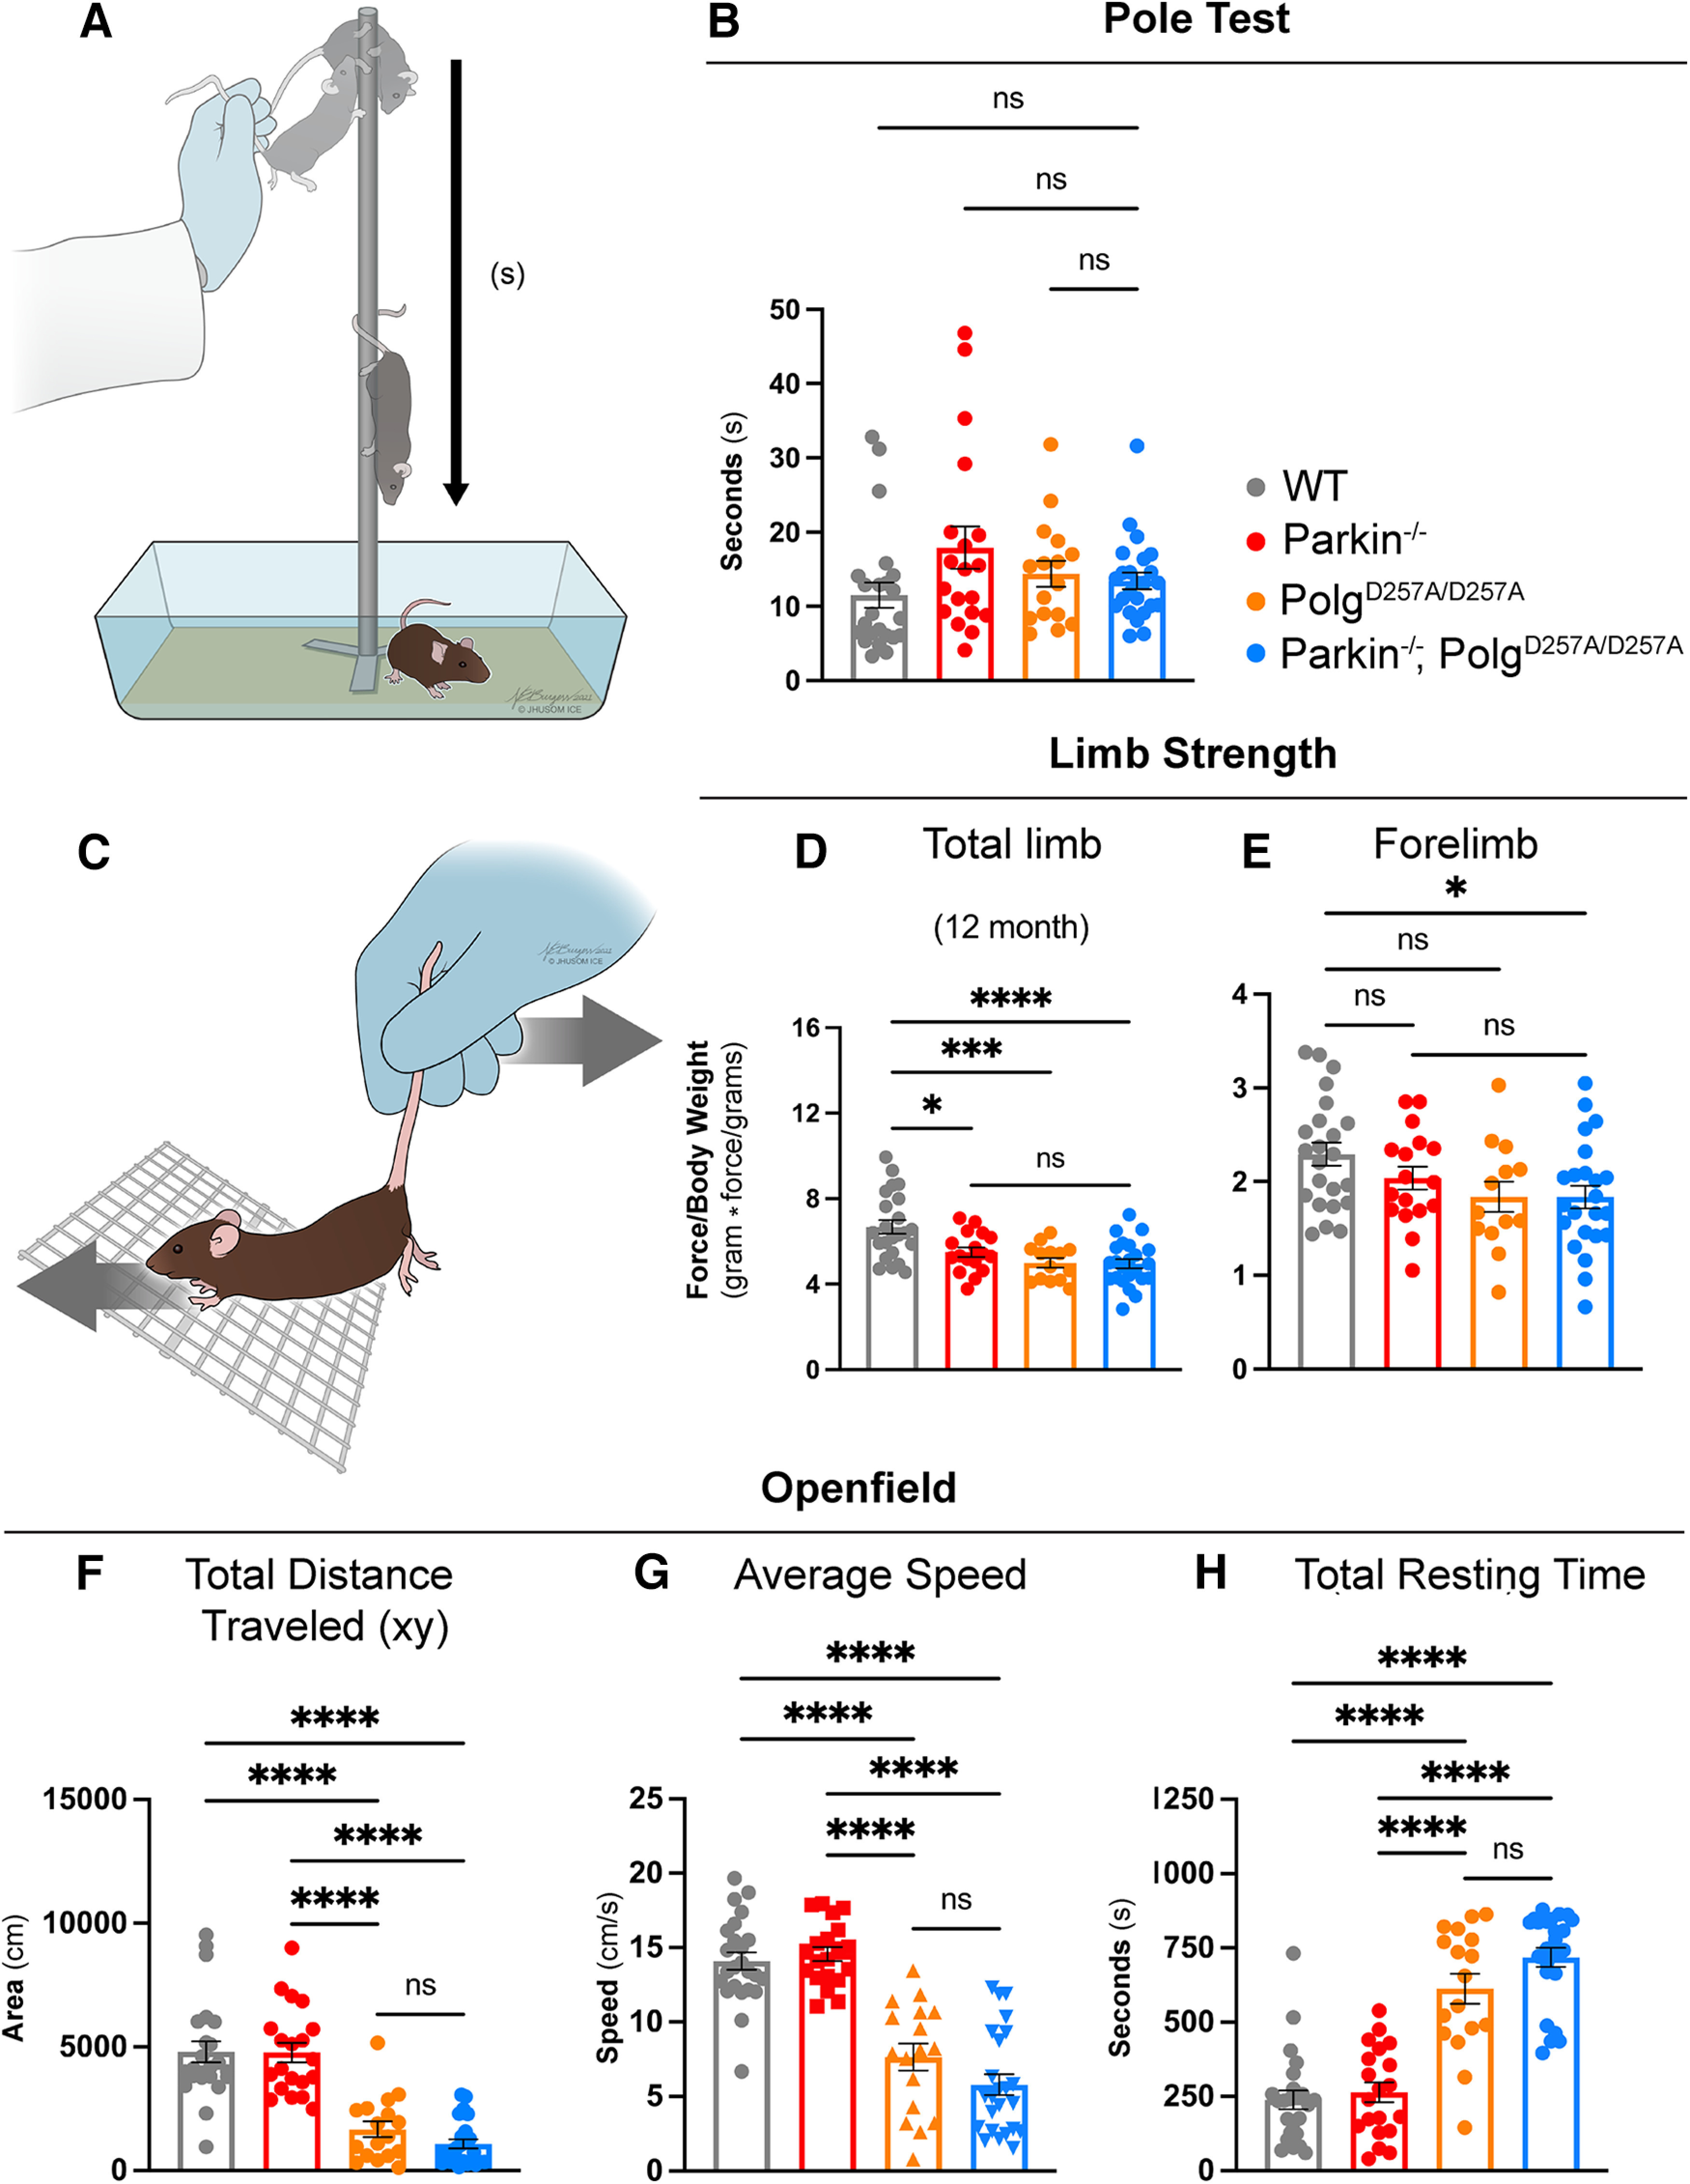
Figure 2.

Behavioral and neuromuscular data of 12-month-old mice. A, Schematic of the pole test. B, Latency values of pole test of 12-month-old mice. Results are the median ± SEM, n = 17–25 per group with an average of five trials per mouse used for analysis. Datasets were unbiasedly analyzed using ROUT outlier analysis with a maximum false discovery rate (q) of 0.1%. Data were found to be non-normally distributed via D'Agostino and Pearson test (with two out of the four groups being found to be non-normally distributed). Significance of medians was analyzed via Kruskal–Wallis nonparametric ANOVA (KW(4,82) = 7.271, p = 0.0637). Post hoc Kruskal–Wallis test for multiple comparisons resulted in no significant differences (ns) between groups. C, Schematic depicting directionality of force (mouse) versus tester in grip strength testing. D, E, Total limb and forelimb strength (in gram*force) normalized to body weight (grams). Results are the mean ± SEM, n = 13–23 per group. Datasets were unbiasedly analyzed using ROUT outlier analysis with a maximum false discovery rate (q) of 0.1%. Data were found to be normally distributed via D'Agostino and Pearson test. Brown–Forsythe test of variance found no difference in SDs. Significance of means was analyzed via an ordinary one-way ANOVA (D: F(3,73) = 10.21 ****p 0.0001; E: F(3,72) = 3.012 *p = 0.0536). Post hoc Tukey's test was performed and resulted in D: *p = 0.0117 for wild-type versus Parkin–/–, ***p = 0.0003 for wild-type versus PolgAD257A/D257A, and ****p 0.0001 for wild-type versus Parkin–/–/PolgAD257A/D257A; E: *p = 0.0398 for wild-type versus Parkin–/–/PolgAD257A/D257A, ns, not significant. Forelimb and total limb strength at three, six, and nine months is provided in Extended Data Figure 2-1. F, Openfield data analyzing total distance traveled in the xy direction during the 15-min testing period. Results are the mean ± SEM, n = 17–24 per group. Datasets were unbiasedly analyzed using ROUT outlier analysis with a maximum false discovery rate (q) of 0.1%. Data were found to be normally distributed via D'Agostino and Pearson test. SDs were found to differ significantly per Brown–Forsythe test of variance. Therefore, significance of means was analyzed via a Welch one-way ANOVA (W(5.0,51.85) = 36.71 ****p 0.0001). Post hoc Dunnett's T3 test resulted in ****p 0.0001 for wild-type versus all PolgAD257A/D257A-expressing mice and for Parkin–/– versus all PolgAD257A/D257A-expressing mice. G, Average speed of locomotion during 15-min test period. Results are the mean ± SEM, n = 17–24 per group. Datasets were unbiasedly analyzed using ROUT outlier analysis with a maximum false discovery rate (q) of 0.1%. Data were found to be normally distributed via D'Agostino and Pearson test. SDs were not found to differ significantly. Significance of means was analyzed via an ordinary one-way ANOVA (F(5,121) = 52.80 ****p 0.0001). Post hoc Tukey's test was performed for and resulted in ****p 0.0001 for wild-type versus all PolgAD257A/D257A-expressing mice and for Parkin–/– versus all PolgAD257A/D257A-expressing mice, ns, not significant. H, Total resting time, defined as a period of four or more seconds with no photobeam breaks, in 15-min test period. Results are the mean ± SEM, n = 17–24 per group. Datasets were unbiasedly analyzed using ROUT outlier analysis with a maximum false discovery rate (q) of 0.1%. Data were found to be normally distributed via D'Agostino and Pearson test. SDs were found to differ significantly per Brown–Forsythe test of variance. Therefore, significance of means was analyzed via a Welch one-way ANOVA (W(5.0,74.83) = 68.21 ****p 0.0001). Post hoc Dunnett's T3 test resulted in ****p 0.0001 for wild-type versus all PolgAD257A/D257A-expressing mice and for Parkin–/– versus all PolgAD257A/D257A-expressing mice, ns, not significant. Analysis and graphs were produced using GraphPad Prism 8.4.3. Distance traveled, average speed and total resting time at three, six, and nine months is provided in Extended Data Figure 2-2. Pole test, forelimb and total strength, distance traveled, average speed, and total resting time in male and female mice at 12 months is provided in Extended Data Figure 2-3.
