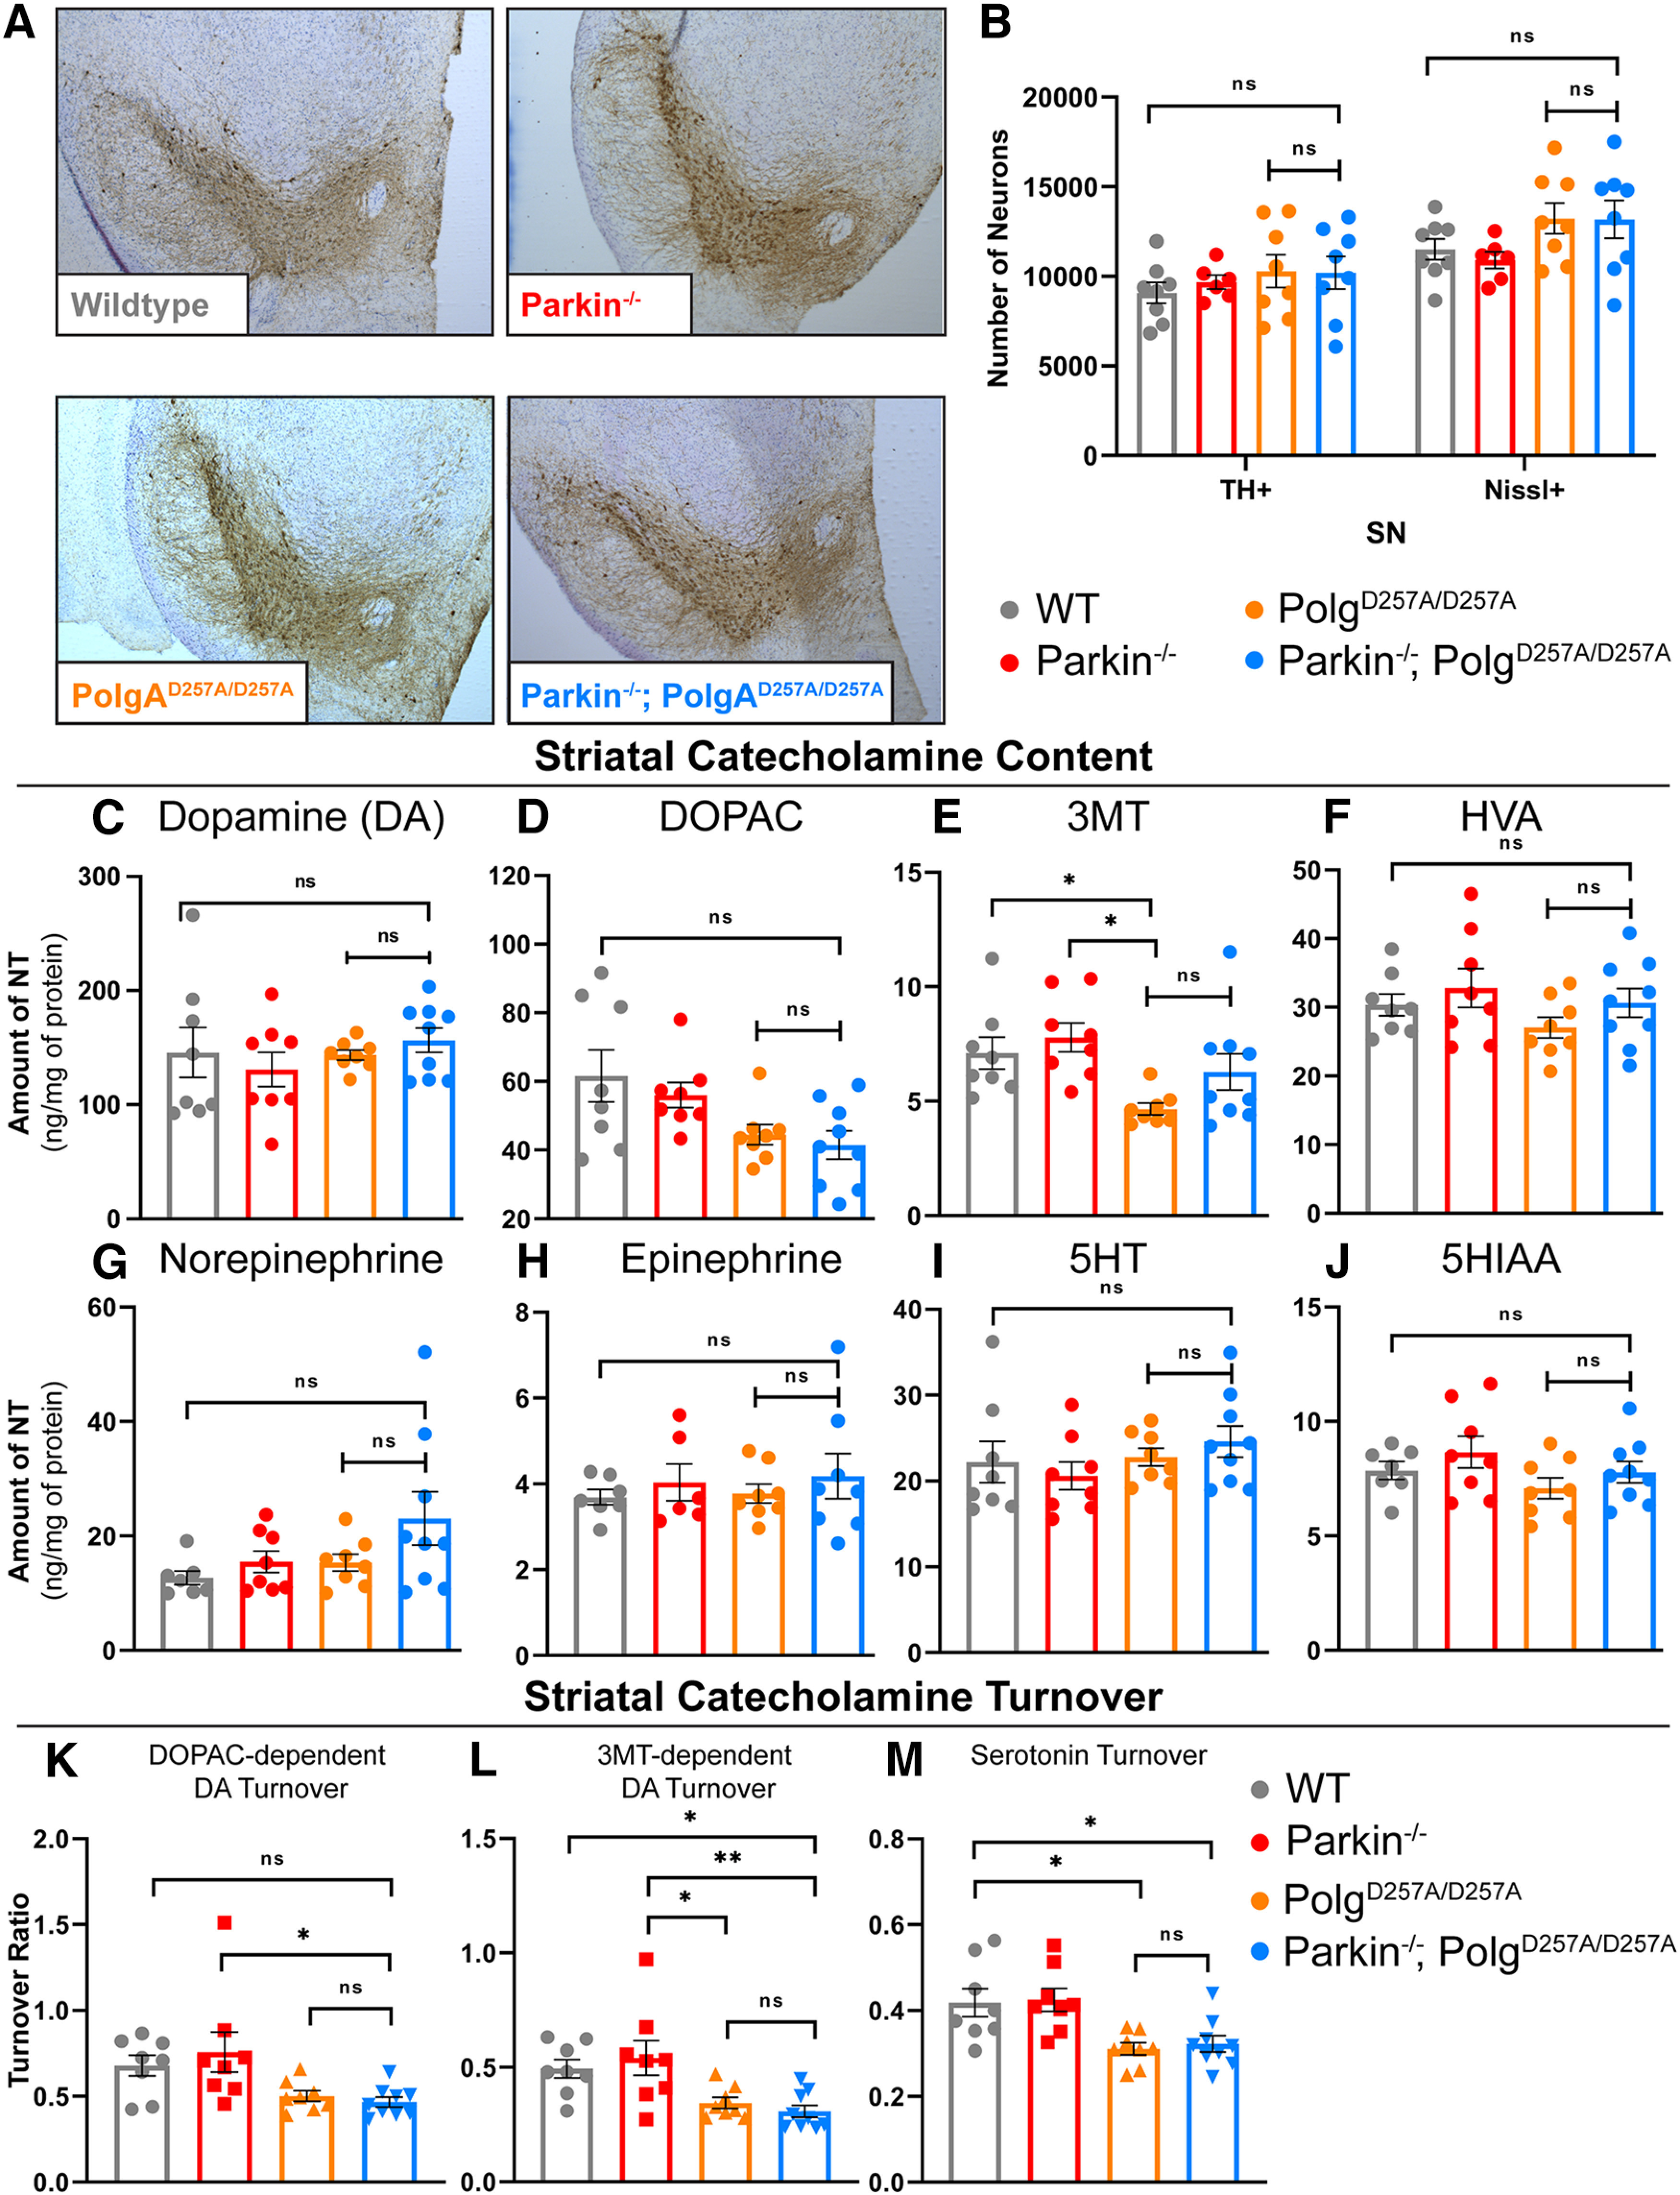
Figure 3.

Neuropathological analysis of ventral midbrain tissue of 12-month-old mice. A, Representative images of immunohistochemical analysis of 12-month-old ventral midbrain sections. TH+ neurons are stained via, 3'-diaminobenzidine (D)AB (Brown) and Nissl+ (a pan-neuronal marker) are stained blue. B, Stereological quantification of TH+ and Nissl + neurons in the substantia nigra. Quantifications multiplied by factor of two to extrapolate to whole-brain values. Results are the mean ± SEM, n = 6–8 per group. Datasets were unbiasedly analyzed using ROUT outlier analysis with a maximum false discovery rate (q) of 0.1%. No outliers were removed. Data were found to be normally distributed via D'Agostino and Pearson test. Data analyzed using two-way ANOVA (Fc(3,52) = 2.143 p = 0.1060), ns, not significant. C, D, HPLC analysis of striatal dopamine and DOPAC content normalized to total protein concentration. Striatum of right hemisphere of 12-month-old mice were used. Quantifications multiplied by factor of two to extrapolate to whole-brain values. Results are the mean ± SEM, n = 8–9 per group. Datasets were unbiasedly analyzed using ROUT outlier analysis with a maximum false discovery rate (q) of 0.1%. Data were found to be normally distributed via D'Agostino and Pearson test. SDs were found to differ significantly per Brown–Forsythe test of variance. Therefore, significance of means was analyzed via a Welch one-way ANOVA (D: W(3.0,13.86) = 0.6434 p = 0.5999; E: W(3.00,15.59) = 3.661 *p = 0.0357). Post hoc Dunnett's T3 test resulted in no significant differences between groups, ns, not significant. E, HPLC analysis of striatal 3MT content normalized to total protein concentration. Striatum of right hemisphere of 12-month-old mice were used. Quantifications multiplied by factor of two to extrapolate to whole-brain values. Results are the median ± SEM, n = 8–9 per group. Datasets were unbiasedly analyzed using ROUT outlier analysis with a maximum false discovery rate (q) of 0.1%. Data were found to be non-normally distributed per D'Agostino and Pearson test. Significance of medians was analyzed via Kruskal–Wallis nonparametric ANOVA (KW(4,33) = 13.17, *p = 0.0043). Post hoc Kruskal–Wallis test for multiple comparisons resulted in **p = 0.0024 for wild-type versus PolgAD257A/D257A and **p = 0.0042 for Parkin–/– versus PolgAD257A/D257A, ns, not significant. F–H, HPLC analysis of striatal HVA, norepinephrine, and epinephrine content normalized to total protein concentration. Striatum of right hemisphere of 12-month-old mice were used. Quantifications multiplied by factor of two to extrapolate to whole-brain values. Results are the median ± SEM, n = 8–9 per group. Datasets were unbiasedly analyzed using ROUT outlier analysis with a maximum false discovery rate (q) of 0.1%. Data were found to be normally distributed via D'Agostino and Pearson test. SDs were not found to differ significantly. Significance of means was analyzed via an ordinary one-way ANOVA (G: F(3,29) = 1.2 p = 0.3050; H: F(3,28) = 2.4 p = 0.0868; H: F(2,25) = 0.3 p = 0.7653), ns, not significant. I, J, HPLC analysis of striatal 5HT and 5HIAA, a 5HT metabolite, content normalized to total protein concentration. Striatum of right hemisphere of 12-month-old mice were used. Quantifications multiplied by factor of two to extrapolate to whole-brain values. Results are the median ± SEM, n = 8–9 per group. Datasets were unbiasedly analyzed using ROUT outlier analysis with a maximum false discovery rate (q) of 0.1%. Data were found to be normally distributed via D'Agostino and Pearson test. SDs were not found to differ significantly. Significance of means was analyzed via an ordinary one-way ANOVA (J: F(3,29) = 0.8779 p = 0.4642; K: F(3,28) = 1.529 p = 0.2286), ns, not significant. K, DOPAC-dependent dopamine turnover as assessed by (DOPAC+HVA)/dopamine. Significance of means analyzed via ordinary one-way ANOVA (F(2,29) = 4.367 *p = 0.0118). Post hoc Tukey's test resulted in *p = 0.0208 for Parkin–/– versus Parkin–/–/PolgAD257A/D257A, ns, not significant. L, 3MT-dependent dopamine turnover as assessed by (3MT+HVA)/dopamine. Significance of means analyzed via ordinary one-way ANOVA (F(2,29) = 6.282 **p = 0.0020). Post hoc Tukey's test resulted in *p = 0.0310 for wild-type versus Parkin–/–/PolgAD257A/D257A, *p = 0.0254 for Parkin–/– versus PolgAD257A/D257A, and **p = 0.0049 for Parkin–/– versus Parkin–/–/PolgAD257A/D257A, ns, not significant. M, Serotonin (5HT) turnover as assessed by 5HIAA/5HT. Significance of means analyzed via ordinary one-way ANOVA (F(2,29) = 6.449 **p = 0.0118). Post hoc Tukey's test resulted in *p = 0.0195 for wild-type versus PolgAD257A/D257A, *p = 0.0355 for wild-type versus Parkin–/–/PolgAD257A/D257A, *p = 0.0121 for Parkin–/– versus PolgAD257A/D257A, and **p = 0.0222 for Parkin–/– versus Parkin–/–/PolgAD257A/D257A, ns, not significant. Analysis and graphs were produced using GraphPad Prism 8.4.3.
