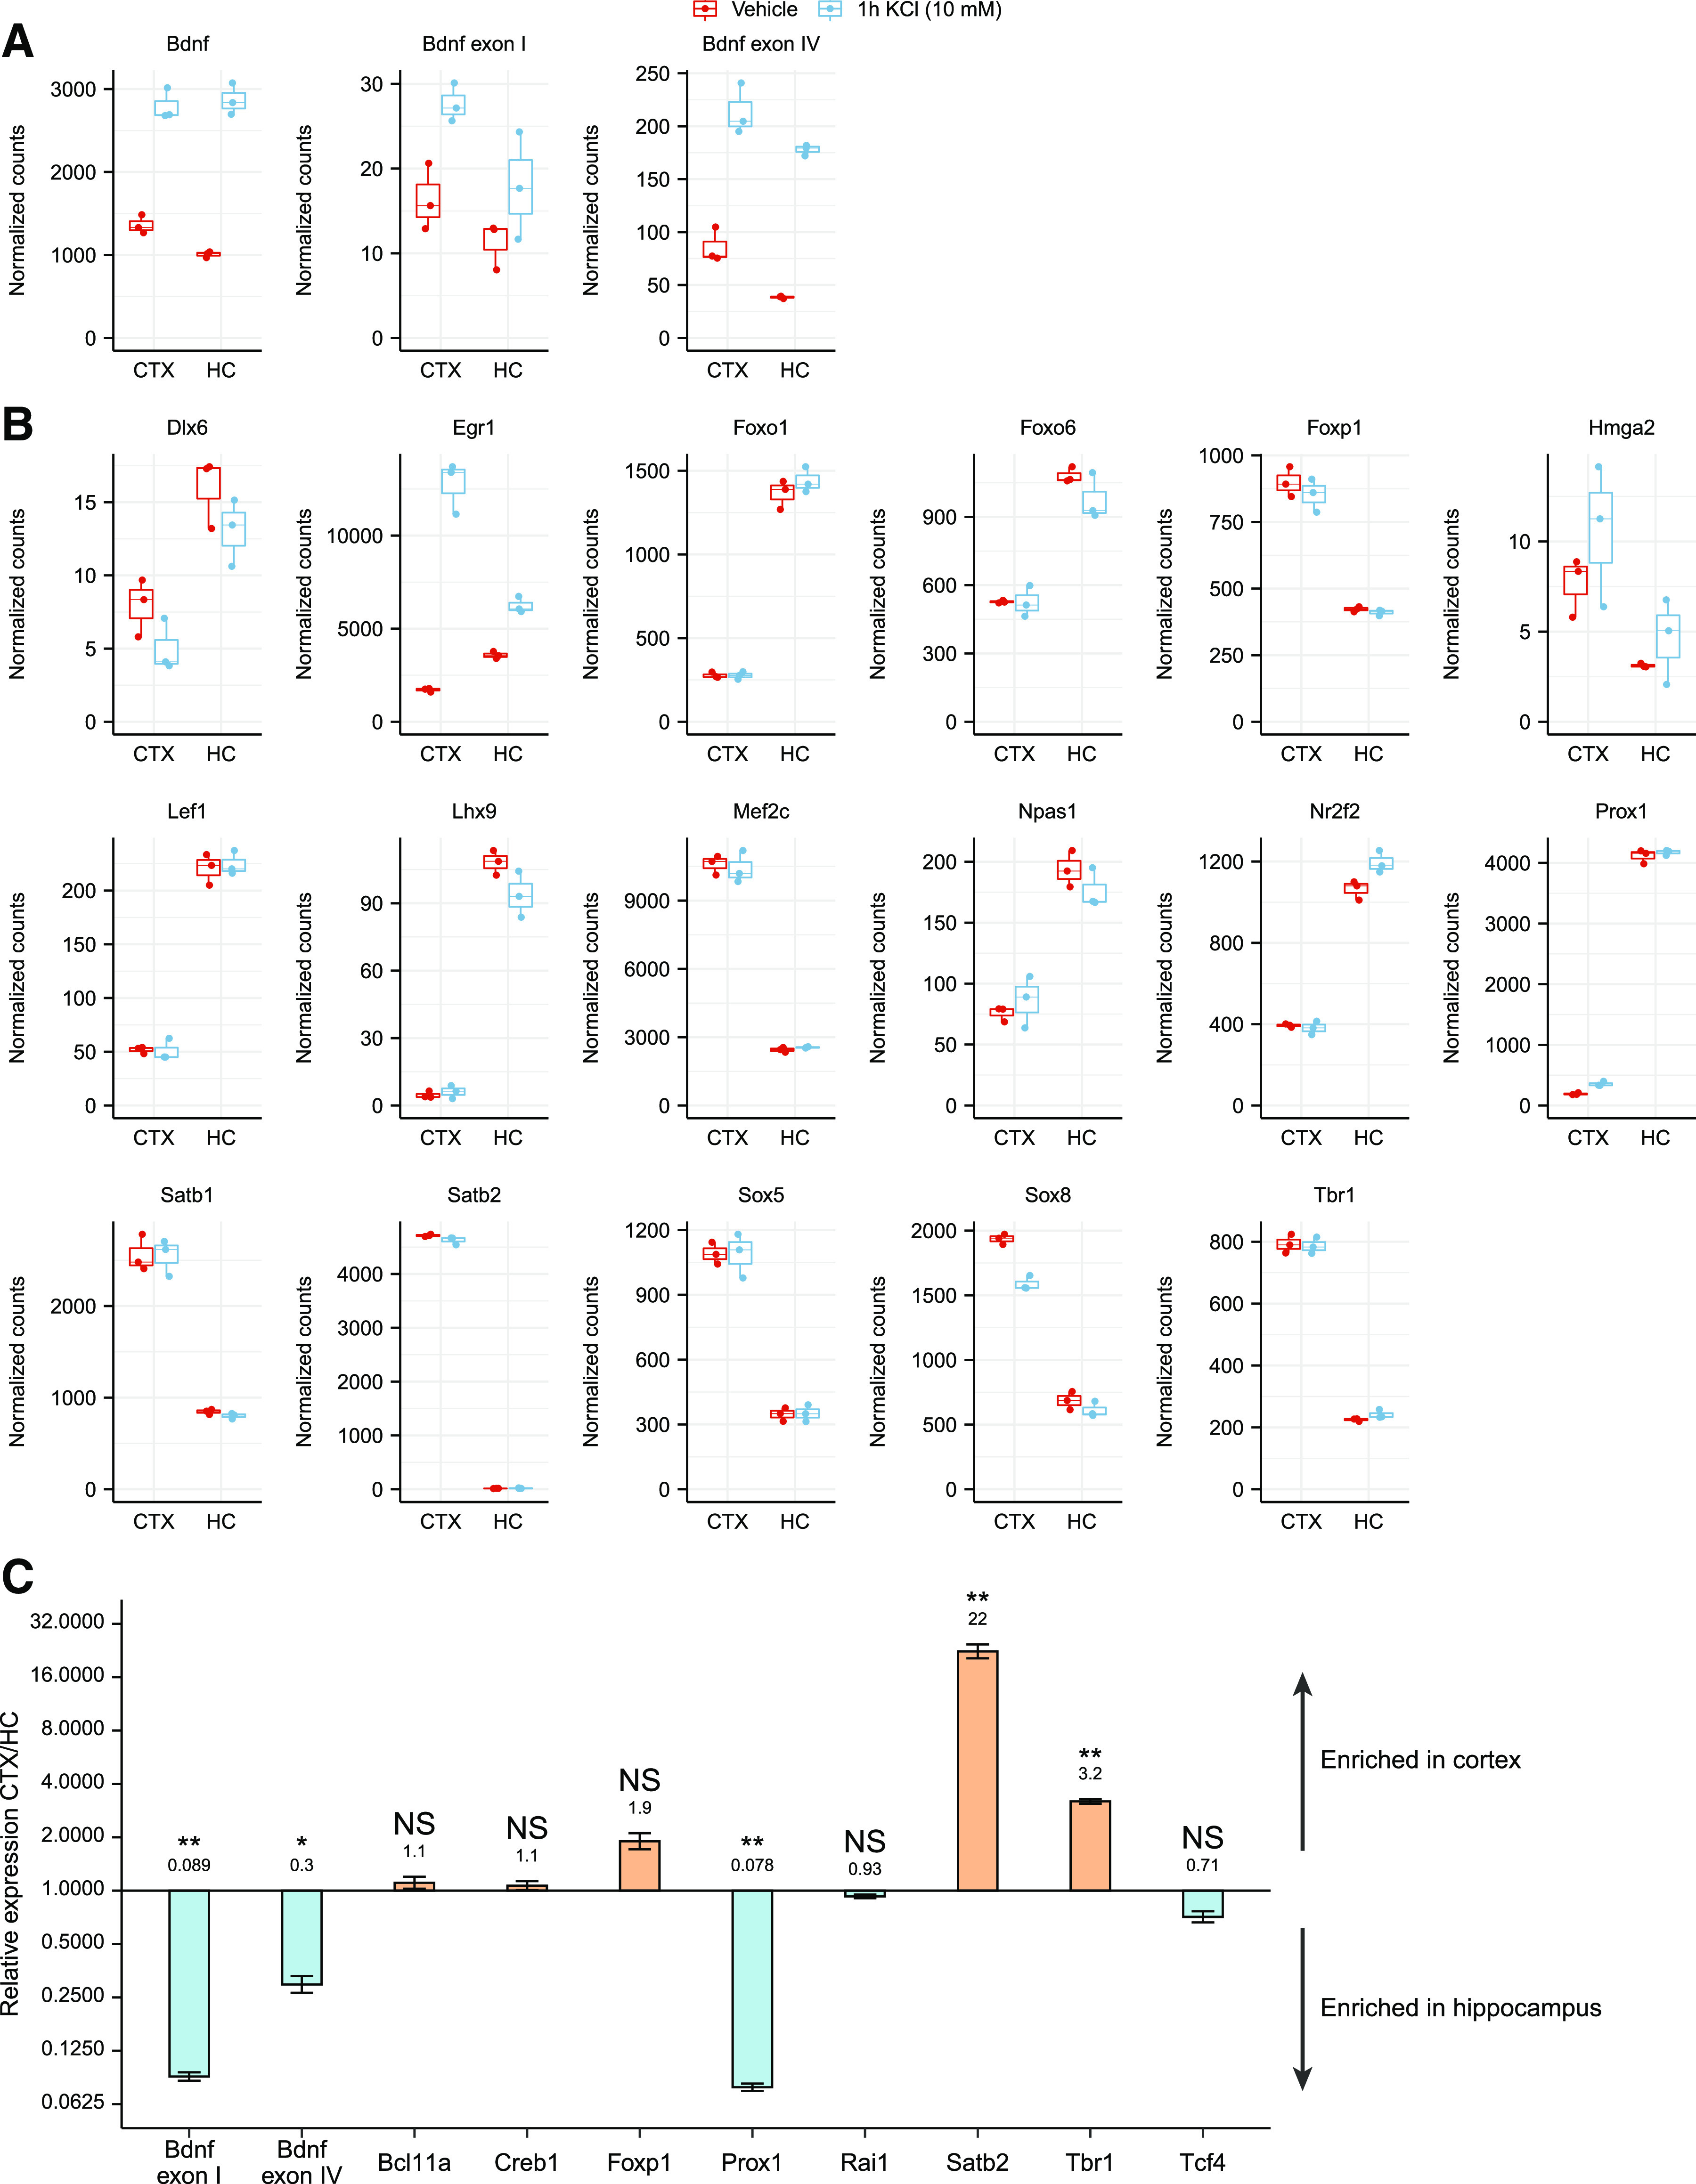
Figure 8.

Various transcription factors that bind BDNF promoters in vitro are differentially expressed in cortical and hippocampal neurons and in cortex and hippocampus in vivo. A, B, RNA-sequencing (RNA-seq) data from embryonic day 18-derived rat cultured cortical (CTX) or hippocampal (HC) neurons treated with 10 mm KCl or vehicle for 1 h at 11 DIV (from Carullo et al., 2020) was used to analyze the expression levels of BDNF (A) and the transcription factors that we determined as specifically bound to BDNF promoter regions in the in vitro promoter pulldown experiment (B). Only transcription factors showing at least 2-fold expression difference between cultured cortical and hippocampal neurons in either untreated or KCl-treated neurons are shown. RNA-seq counts were normalized with DESeq2 and are shown as box plots, where the hinges show 25% and 75% quartiles, the horizontal line shows the median value, the upper whisker extends from the hinge to the largest value no further than 1.5× interquartile range from the hinge, the lower whisker extends from the hinge to the smallest value at most 1.5× interquartile range of the hinge. All data points are shown with dots. Expression data and statistical analysis for all the transcription factors detected to bind BDNF promoters in the in vitro pulldown assay are listed in Extended Data Figure 8-1. C, mRNA levels of the selected transcription factors in cortex and hippocampus of P8 Sprague Dawley pups shown as relative to the expression levels in cortex measured by RT-qPCR (group averages and exact p-values are listed in Extended Data Fig. 8-2). The expression levels of the determined transcription factors in the human cortex based on the GTEx portal are shown in Extended Data Figure 8-3. Error bars represent upper and lower limits of back-transformed mean ± SEM of three different litters (n = 3). Statistical significance is shown compared with the expression levels in cortex. *p < 0.05, **p < 0.01, ***p < 0.001, paired two tailed t test, corrected for multiple comparisons using Holm–Šídák method.
