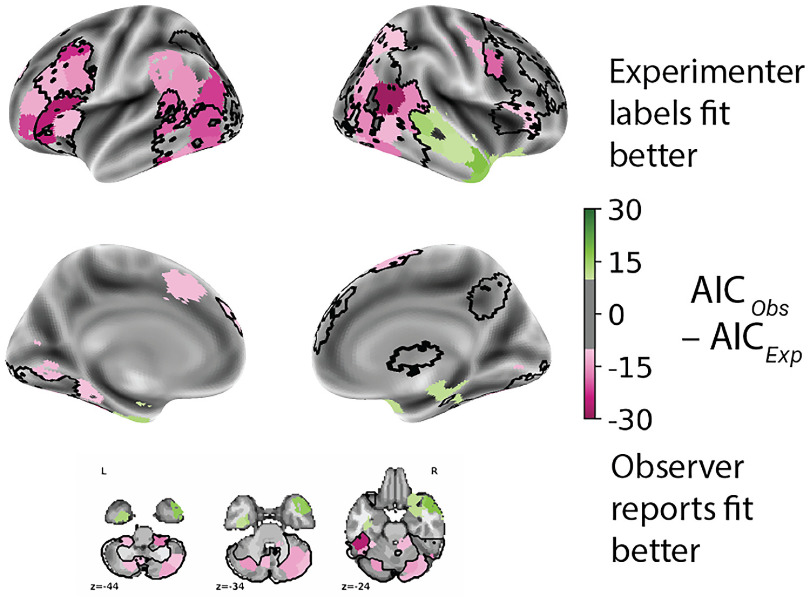
Figure 4.
Models based on observer reports, compared with experimenter labels, better explain brain activity in robust social perception regions. Comparison between two linear mixed-effects models fitting trial-level GLM regression coefficients (β) as a function of either (1) observer responses (“Social” vs “Non-social”) or (2) experimenter labels (Mental vs Random). Parcels are colored by the difference in AIC between the two models and were thresholded at 10 (i.e., parcels with |AIC| < 10 are not plotted); parcels colored pink (difference in AIC < −10) indicate a better fit for the observer response-based model, and those colored green (difference in AIC > 10) indicate a better fit for the experimenter label-based model. Both models included participant and animation as random effects. Black contours correspond to the robust social perception regions identified in Figure 3, and these largely overlap with parcels that show better fits for the observer-based models (pink).

