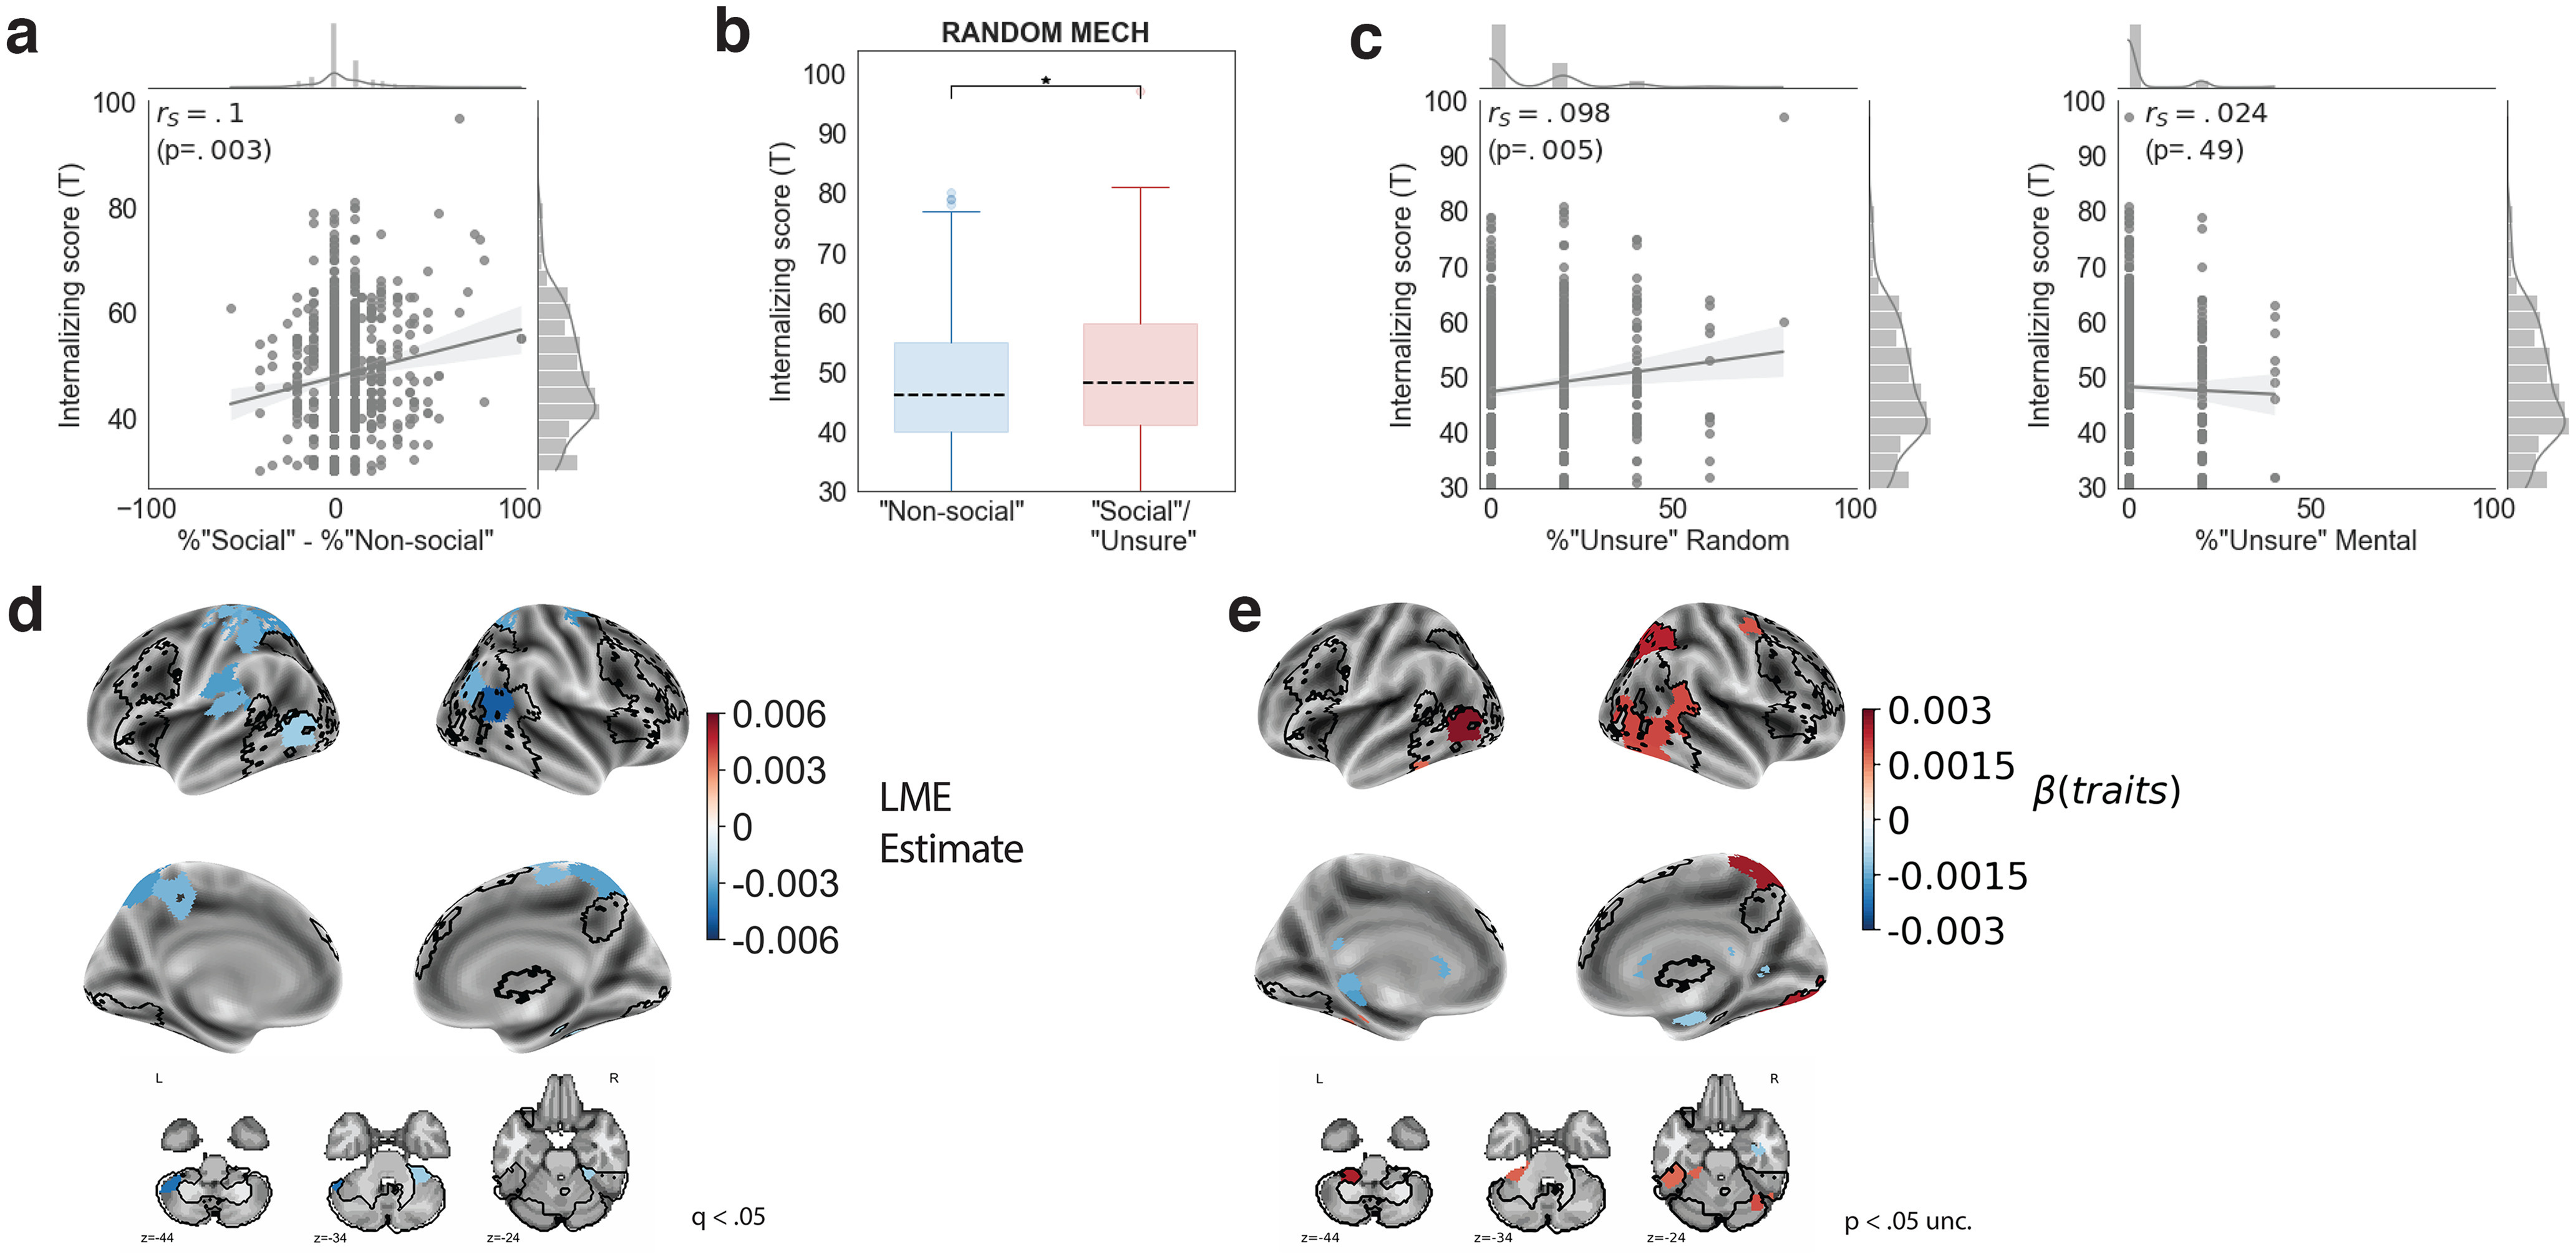
Figure 7.

Relationship between internalizing trait scores, behavior, and brain activity. a, Response bias (percentage difference between “Social” and “Non-social” responses per participant) correlates positively with internalizing symptom score (Spearman's correlation coefficient, rs = 0.1, p = 0.003). b, Internalizing scores among individuals who reported some degree of socialness (“Social” or “Unsure” responses) to the most ambiguous animation, RANDOM MECH, were higher than those for individuals who reported this animation “Non-social”; *p < 0.05. c, Internalizing score correlates positively with the percentage of “Unsure” responses per participant for the generally non-social animations (Random, left, rs = 0.098, p = 0.005) but not for the generally social animations (Mental, right, rs = –0.024, p = 0.49). These correlation magnitudes were significantly different (t = 2.47, p = 0.007). d, Relationship between neural responsiveness during the task and internalizing scores. Colored parcels showed a significant positive (red) or negative (blue) relationship (FDR q < 0.05) with internalizing score. The robust social perception regions from the GLM analysis (compare Fig. 3) are shown in black. All regions show a negative relationship between activation magnitude and internalizing symptoms, and there is only a partial overlap with the robust social perception regions. e, Parcels in which the difference between activity to “Social” and “Non-social” percepts (compare Fig. 3c) may be modulated by internalizing symptoms (p < 0.05, uncorrected). Red indicates that at higher internalizing symptoms, “Social” trials show a relatively higher response than “Non-social”, and blue indicates that at higher internalizing symptoms, “Social” trials show a relatively lower response than “Non-social” (blue).
