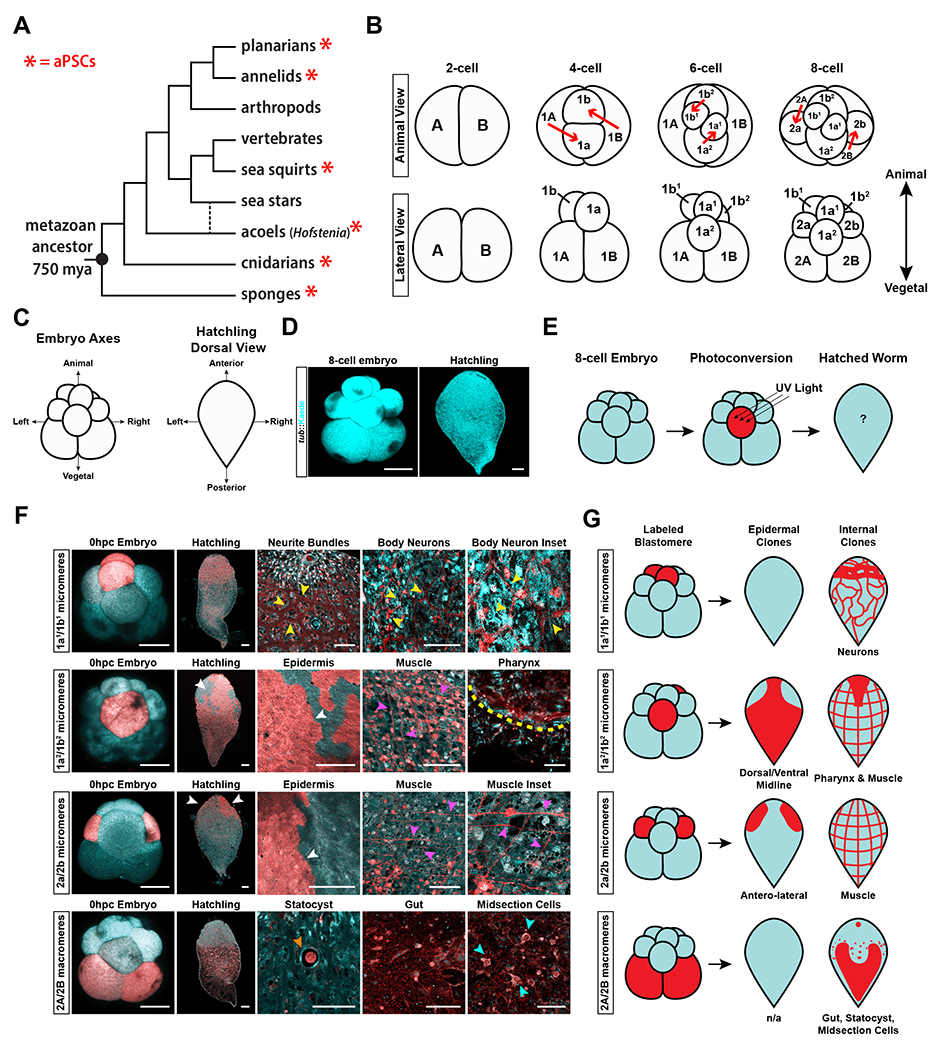
Figure 1: Lineage tracing using photoconvertible transgenic embryos reveals the cellular sources for major tissue types.

(A) Metazoan tree of life showing the widespread occurrence of adult pluripotent stem cells (aPSCs) (red asterisk) in many lineages and their absence in mammals (vertebrates). The branch for acoels is dotted to indicate two phylogenetic positions currently under debate35–37. (B) Schematic diagram showing the stereotyped duet cleavage pattern of Hofstenia miamia embryos from the 2-cell to 8-cell stage. Top: Animal view of the cleavage pattern. Red arrows show the direction of cleavage to generate blastomeres. Bottom: Lateral view of embryos. The animal and vegetal axis corresponding to the lateral view is denoted in bold arrows (C) Schematic diagram of embryonic and adult axes, relating to D, E, F, and G. Left: Embryonic axes labeled at the 8-cell stage embryo when viewed laterally. Right: Adult body axes labeled on a hatchling worm when viewed from the dorsal side. (D) Images of a tuba::Kaede transgenic 8-cell stage embryo and hatchling worm (pseudo-colored in cyan). (E) Schematic showing the workflow for photoconversion. (F) Fate-mapping of 8-cell state embryos via photoconversion of pairs of blastomeres. Single-cell conversions are shown in Fig. S1D. 1a1/1b1 cells give rise to neurons in the adult, with large neurite bundles being visible in the anterior, and a net-like structure of body neurons throughout the body (yellow arrowheads) (n=10/10). 1a2/1b2 cells give rise to the dorsal-ventral-midline epidermis (white arrowhead), muscle (magenta arrowheads), and the pharynx (yellow dotted line) (n=12/12). 2a/2b cells give rise to the anterior-lateral epidermis (white arrowheads), and muscle (magenta arrowheads) (n=6/6). 2A/2B cells give rise to the statocyst (orange arrowhead), gut, and a population of internal, midsection cells (cyan arrowheads) (n=4/4). The same worms shown here were also followed during embryonic development, shown in Fig. S1C. (G) Schematic diagrams of the cell types generated by each pair of blastomeres. All images of hatchlings were taken with a 10x objective, all embryo images were taken under 20x magnification. Images of specific tissues, regions, or insets were taken at high magnification under a 63x objective. Embryo and hatchling scale bars = 100μm. High magnification image scale bars = 50μm. See also Figure S1, Video S1, Video S2, Video S3, and Videol S4.
