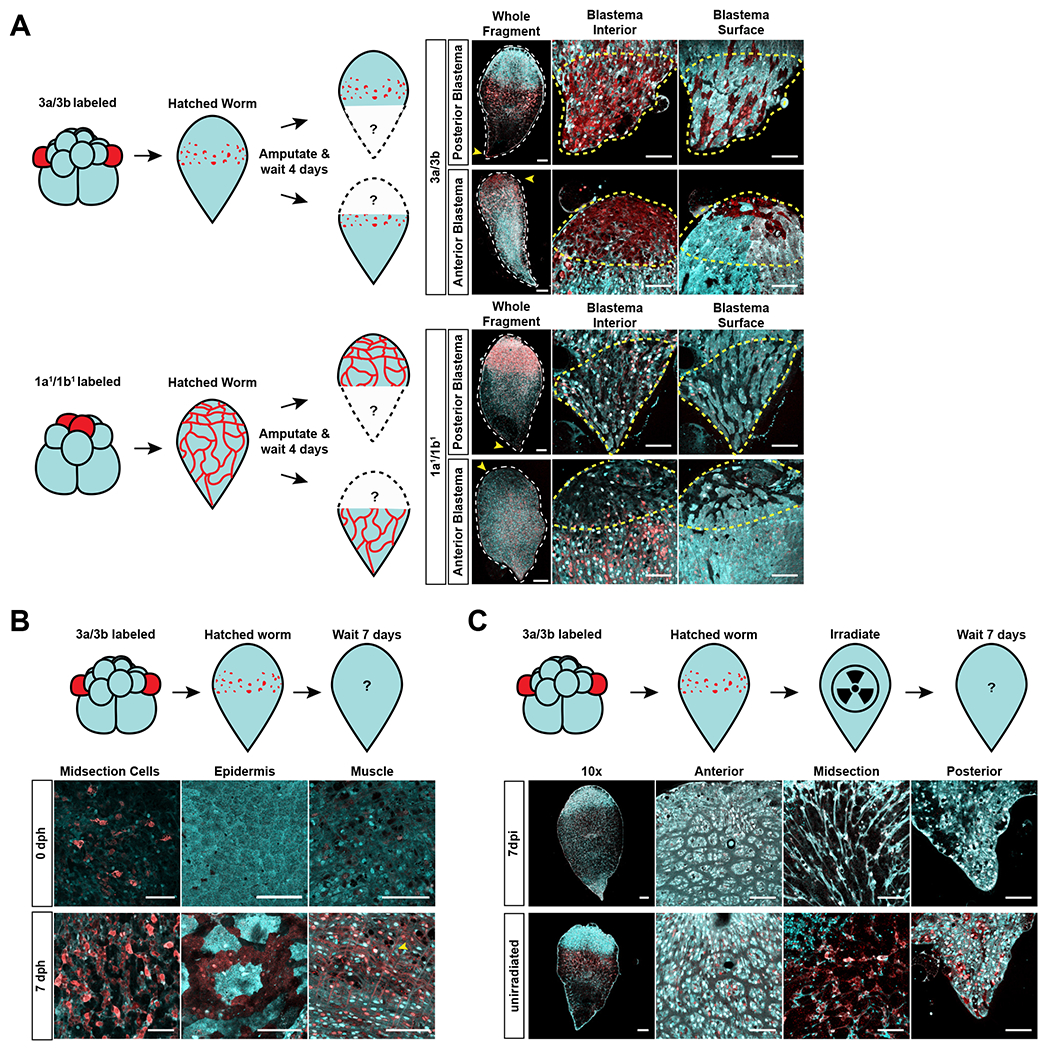
Figure 3: 3a/3b micromere progeny exhibit functional characteristics of neoblasts.

(A) Top Left: Schematic of experimental design for testing the contribution of 3a/3b progeny to the blastema. Top Right: Red labeling from the 3a/3b progeny spread to the blastema (yellow arrowhead in whole fragment images, outlined in yellow dashed lines in high magnification images of blastema) during anterior (n=5/5) and posterior regeneration (n=3/3), showing contribution to newly regenerated tissue. Both interior and surface z-slices of the blastema show the spread of red labeling to new tissue. Bottom Left: Schematic of experimental design for testing the contribution of 1a1/1b1 progeny to the blastema. Bottom Right: Red labeling from the 1a1/1b1 progeny did not spread to the blastema (yellow arrowhead in whole fragment images, outlined in yellow dashed lines in high magnification images of blastema) during anterior (n=3/3) or posterior regeneration (n=3/3), showing absence of contribution to newly regenerated tissue. Both interior and surface z-slices of the blastema do not show the spread of red labeling to new tissue. Images to the right of the hatchling images show high magnification views of relevant areas. Scale bars for hatchling images = 100μm. Scale bars for high magnification images = 50μm. Progeny of other blastomeres at the 16-cell stage also did not contribute to newly regenerated tissue– see Fig. S3B and S3C. (B) Top: Schematic of experimental design for testing the contribution of 3a/3b progeny to homeostatic tissue differentiation. Bottom: At 7 days post hatching (dph), 3a/3b labeled worms showed an increase in the number of midbody cells as well as presence of red labeling to epidermis and muscle (3/3), which were absent in animals that had just hatched (0 dph) (3/3). Scale bars = 50μm. Progeny of other blastomeres that normally do not contribute to epidermis or muscle showed no detectable contribution to these tissues during homeostasis – see Fig. S3D (C) Top: Schematic of experimental design for testing the sensitivity of 3a/3b progeny to radiation. Bottom: 3a/3b progeny are not detectable 7 days post irradiation (dpi) (4/4), in contrast to in unirradiated worms (3/3). Progeny of other blastomeres were not irradiation sensitive - see Fig. S3E. Images to the right of the hatchling images show high magnification views of relevant areas. Scale bars for hatchling images = 100μm. Scale bars for high magnification images = 50μm. See also Figure S3.
