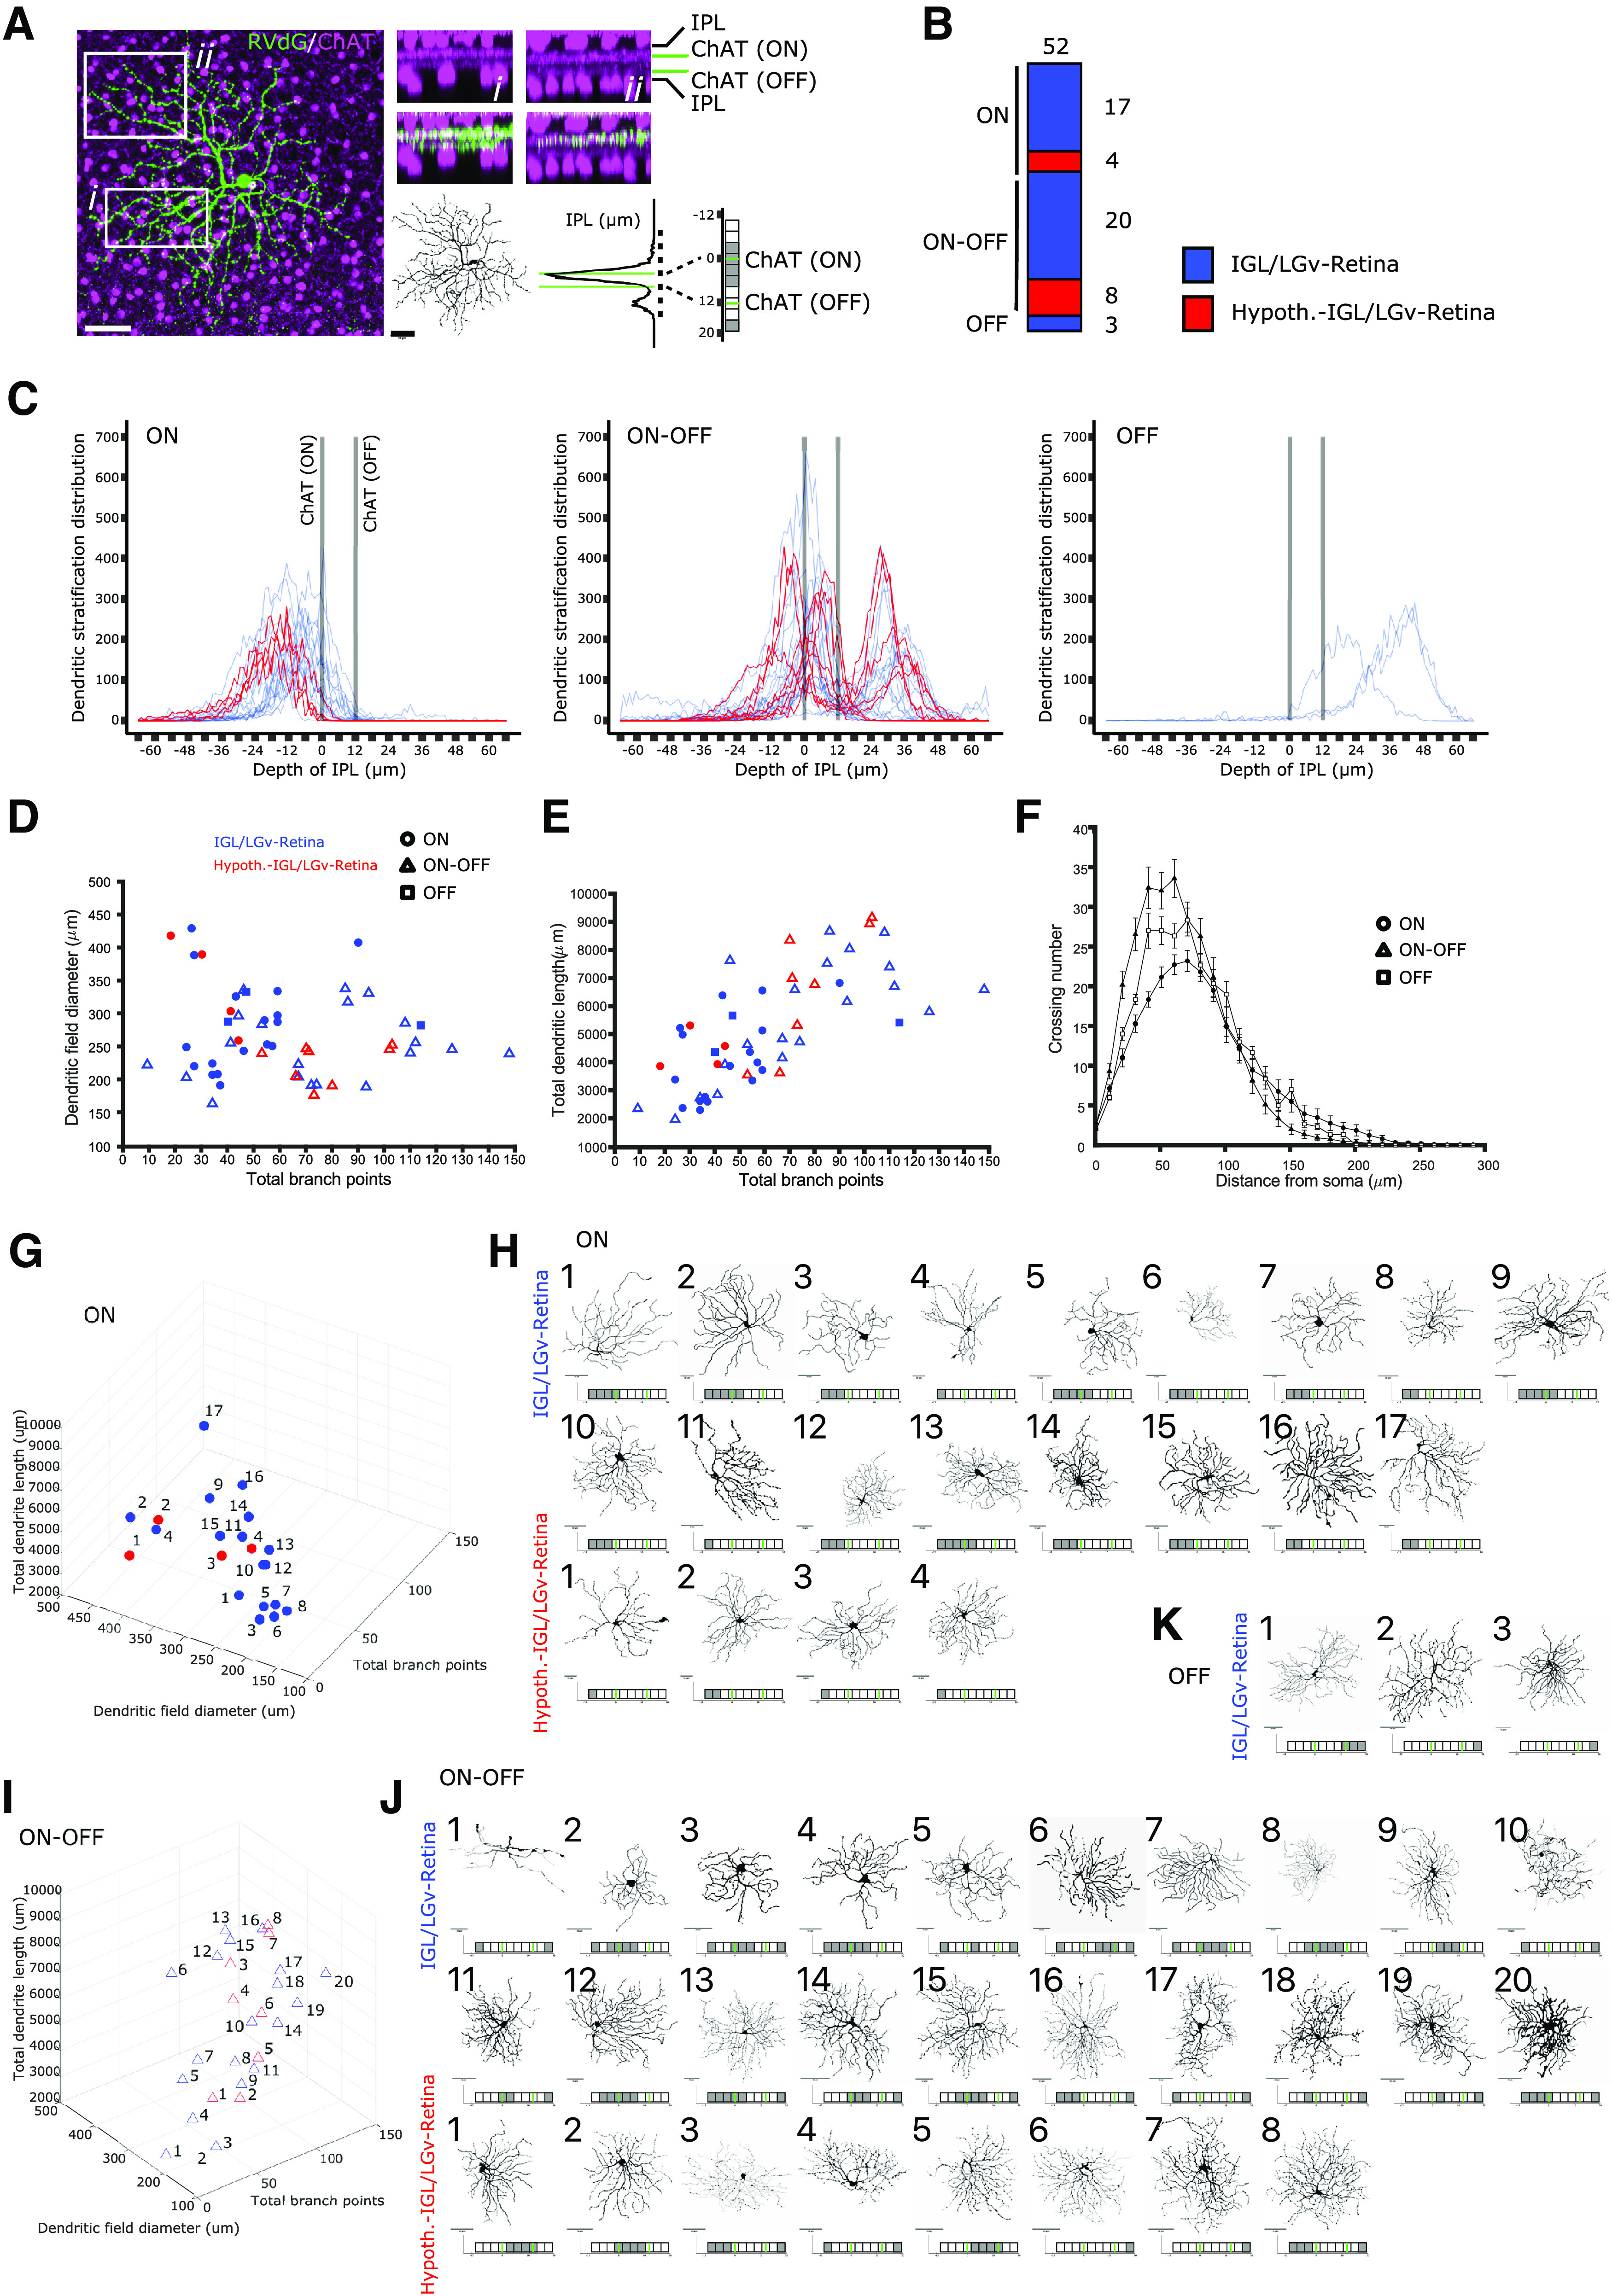
Figure 5.

Dendritic morphology of RGCs projecting to Sox14+ neurons in the IGL/LGv. A, Example images illustrating the strategy for the morphologic analysis of RGC dendrites and their stratification in the IPL. The IPL is visualized sandwiched between ChAT+ amacrine cell somas (magenta) for two arbitrary regions (i and ii) of an RVdG infected RGC (green). The dendritic reconstruction of the RGC is presented as black skeleton and the raw density of the GFP signal in the IPL is subdivided along 10 bins using gray color for thresholding. Green lines represent ChAT+ ON and OFF laminar references. Scale bars: 50 µm. B, Morphologic analysis was conducted for RGCs that did not have overlapping dendrites with other labeled RGCs. Graphical representation of the proportion of ON, ON-OFF and OFF stratifying RGCs, color coded in blue when labeling occurred after RVdG injection in the IGL/LGv and in red when labeling occurred after RVdG injection in the hypothalamic region of the SCN (cumulative values from 9 mice). C, Distribution of dendritic densities for each of the 52 reconstructed RGCs, grouped according to their stratification in the ON and OFF laminas of the IPL and color coded in blue or red as in B. D, E, Scatter plots displaying the dendritic field diameter and total dendritic length against the total dendritic branch points for all 52 reconstructed RGCs, color coded in blue or red as in B. Filled circles represent the cells in the ON cluster, triangles the cells in the ON-OFF cluster and squares the cells in the OFF cluster. F, Scholl analysis for the three clusters of RGCs, without color coding to indicate location of the RVdG injection. G, 3D rendering of the morphologic features in D, E for the ON RGC cluster, color coded in blue or red according to the tracing strategy. H, Reconstructed dendritic trees and dendritic stratification profiles of retrogradely traced RGCs in the ON cluster, numbered according to their increasing branch points and divided according to the labeling strategy. Scale bars: 50 µm. I, 3D rendering of the morphologic features in D, E for the ON-OFF RGC cluster, color coded in blue or red according to the tracing strategy. J, Reconstructed dendritic trees and dendritic stratification profiles of retrogradely traced RGCs in the ON-OFF cluster, numbered according to their increasing branch points and divided according to the labeling strategy. Scale bars: 50 µm. K, Reconstructed dendritic trees and dendritic stratification profiles of retrogradely traced RGCs in the OFF cluster which is only labeled by the RVdG injection in the IGL/LGv. Scale bars: 50 µm.
