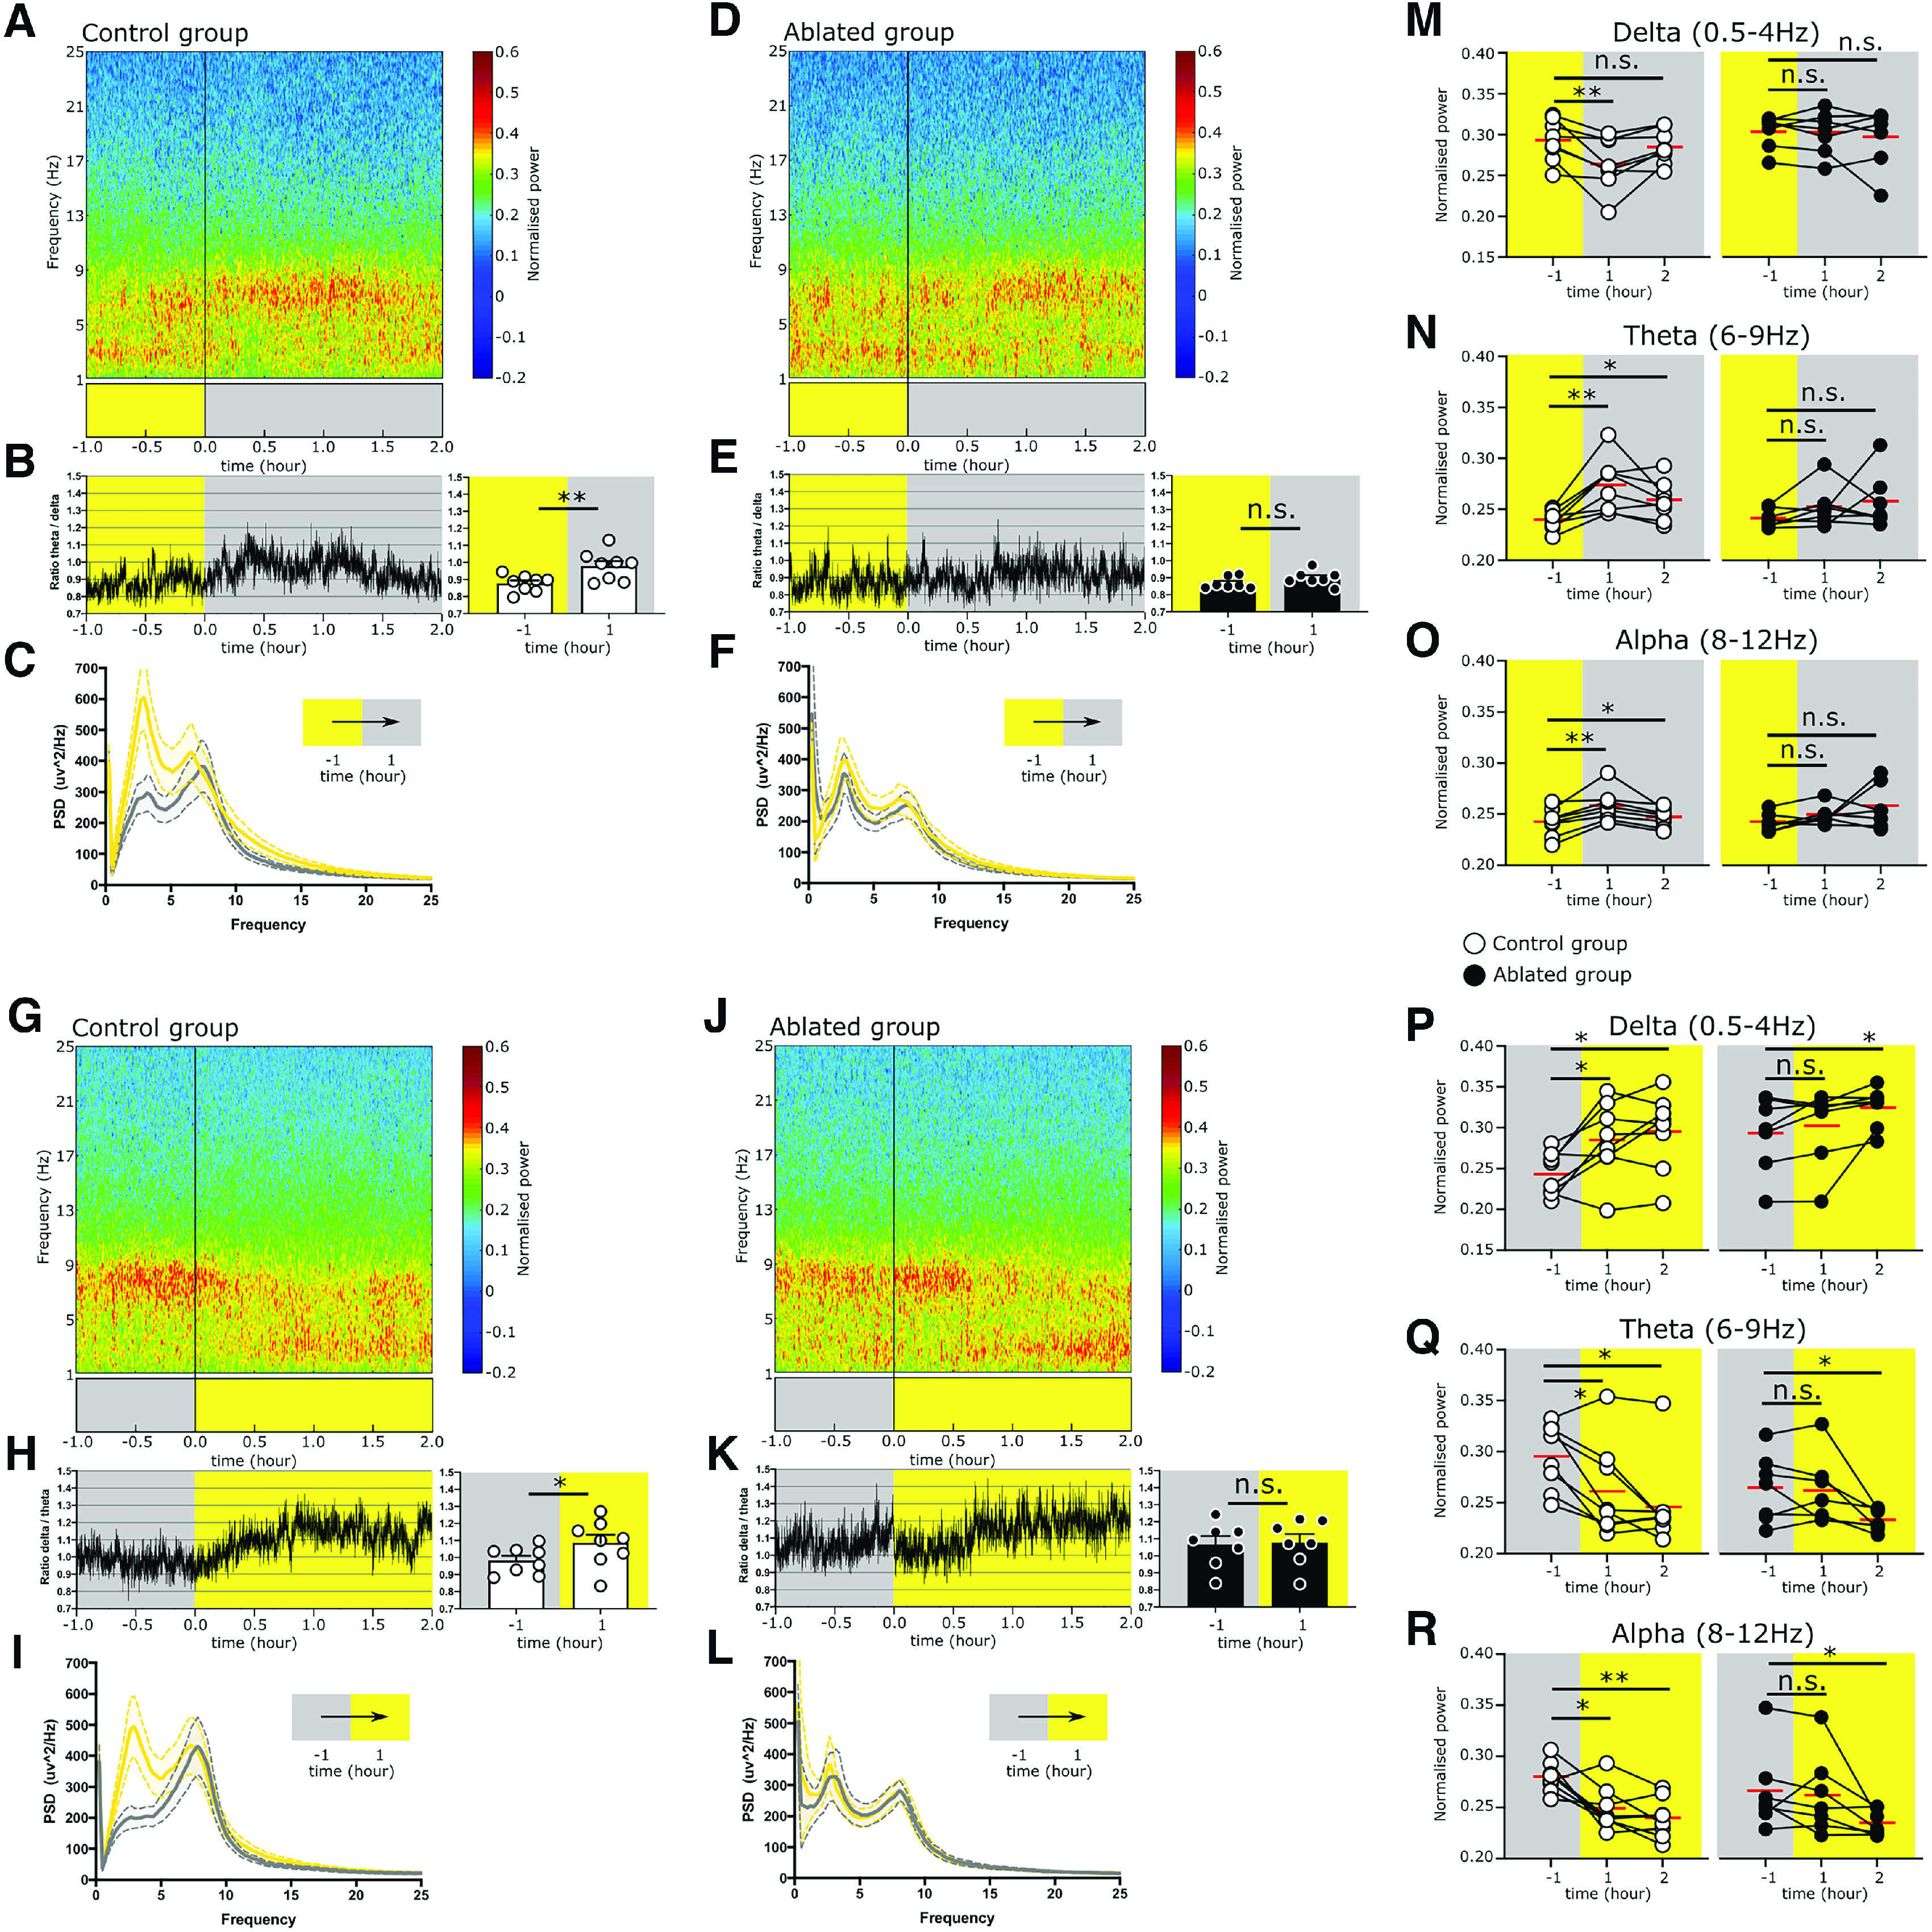
Figure 9.

The Sox14+ IGL/LGv neurons are required for the rapid onset of cortical network activity associated with circadian light transitions. A, Averaged cortical spectrogram for the Control group displaying a rapid increase in the θ power and decrease in δ power at the transition from lights on to lights off. B, the change in θ and δ is displayed as a group average θ/δ ratio over time and as cumulative for the hour preceding and the hour following the light change. Control group (T/D)−1: 0.87 ± 0.01 versus (T/D)1: 0.97 ± 0.03, p = 0.001. Values are mean ± SEM, t test. C, Power spectrum of the Control group in the hour preceding the transition from light to dark is overlayed to the power spectrum profile for the hour following the light transition (bold line: mean; dotted lines: ±SEM; yellow: light, gray: dark). D, Averaged cortical spectrogram for the Ablated group displaying retention of high δ power following the lights on to lights off transition. E, Change in θ and δ is displayed as a group average θ/δ ratio over time and as cumulative for the hour preceding and the hour following the light change. Ablated group (T/D)−1: 0.86 ± 0.01 versus (T/D)1: 0.89 ± 0.01, p = 0.078. Values are mean ± SEM, Wilcoxon test. F, Power spectrum of the Ablated group in the hour preceding the transition from light to dark is overlayed to the power spectrum profile for the hour following the light transition (bold line: mean; dotted lines: ±SEM; yellow: light, gray: dark). G, Averaged power spectrum for the Control group in the hour preceding and the 2 h following the lights off to lights on transition. H, Change in the δ/θ ratio is plotted over time and as group mean for the hour preceding and following the light transition. Control group (D/T)−1: 0.98 ± 0.02 versus (D/T)1: 1.08 ± 0.04, p = 0.016. Values are mean ± SEM, t test. I, Power spectrum of the Control group in the hour preceding the transition from dark to light overlayed to the power spectrum profile for the hour following the light transition (bold line: mean; dotted lines: ±SEM; yellow: light, gray: dark). J, K, L, Same analysis as in G-H is applied to the Ablated group. Note that the Ablated group does not display a significative change in the δ/θ ratio. Ablated group (D/T)−1: 1.06 ± 0.05 versus (D/T)1: 1.07 ± 0.05, p = 0.623. Values are mean ± SEM, t test. M, Pairwise comparison for the δ power for the hour preceding and each of the 2 h following the transition from lights on to lights off in the Control group (white circles) and Ablated group (filled black circles). Control group δ–1: 0.29 ± 0.009, δ1: 0.26 ± 0.01 p = 0.009, δ2: 0.28 ± 0.007 p = 0.323. Values are mean ± SEM, t test. Ablated group δ–1: 0.30 ± 0.007, δ1: 0.30 ± 0.009 p = 0.734, δ2: 0.29 ± 0.013 p = 0.937. Values are mean ± SEM, Wilcoxon test. N, Pairwise comparison for the θ power for the hour preceding and each of the 2 h following the transition from lights on to lights off in the Control group (white circles) and Ablated group (filled black circles). Control group θ–1: 0.23 ± 0.003, θ1: 0.27 ± 0.009, p = 0.002, θ2: 0.25 ± 0.006, p = 0.105. Values are mean ± SEM, t test. Ablated group θ–1: 0.24 ± 0.003, θ1: 0.25 ± 0.007 p = 0.109, θ2: 0.25 ± 0.01, p = 0.109. Values are mean ± SEM, Wilcoxon test. O, Pairwise comparison for the α power for the hour preceding and each of the 2 h following the transition from lights on to lights off in the Control group (white circles) and Ablated group (filled black circles). Control group α–1: 0.24 ± 0.004, α1: 0.25 ± 0.005, p = 0.003, α2: 0.24 ± 0.003, p = 0.045. Values are mean ± SEM, t test. Ablated group α–1: 0.24 ± 0.003, α1: 0.24 ± 0.003, p = 0.109, α2: 0.25 ± 0.008, p = 0.097. Values are mean ± SEM, Wilcoxon test. P, R, Similar pairwise analysis as in M–O but for the transition from lights off to lights on. Control group δ–1: 0.24 ± 0.009, δ1: 0.28 ± 0.016, p = 0.009, δ2: 0.29 ± 0.016, p = 0.019. Ablated group δ–1: 0.29 ± 0.017, δ1: 0.30 ± 0.017, p = 0.296, δ2: 0.32 ± 0.009, p = 0.036. Values are mean ± SEM, t test except for the Ablated group δ2 comparison which used a Wilcoxon test. Control group θ–1: 0.29 ± 0.011, θ1: 0.26 ± 0.016, p = 0.023, θ2: 0.24 ± 0.014, p = 0.023. Values are mean ± SEM, Wilcoxon test. Ablated group θ–1: 0.26 ± 0.012, θ1: 0.26 ± 0.012, p = 0.706, θ2: 0.23 ± 0.003, p = 0.038. Values are mean ± SEM, t test. Control group α–1: 0.27 ± 0.005, α1: 0.24 ± 0.007, p = 0.012, α2: 0.23 ± 0.006, p = 0.005. Values are mean ± SEM, t test. Ablated group α–1: 0.26 ± 0.014, α1: 0.26 ± 0.014, p = 0.375, α2: 0.23 ± 0.004, p = 0.046. Values are mean ± SEM, Wilcoxon test. N.s.: not statistically significant. A summary of statistical tests is available in Extended Data Table 9-1.
