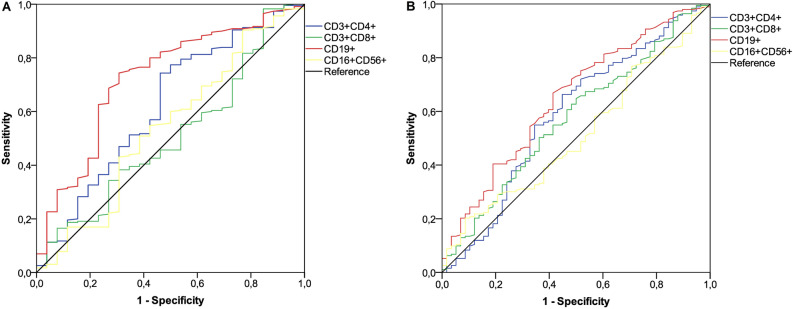
Figure 2.
ROC curve analysis. Receiver operating characteristic (ROC) curves are represented for subsets of peripheral lymphocytes. (A) ROC analysis showing the performance of absolute counts of peripheral lymphocyte subsets in distinguishing positive seroconversion responses at timepoint-1. AUC for the subpopulation relative values: T helper cells (CD3 + CD4 +): 0.62 (95% CI 0.49–0.74; P = 0.044); T cytotoxic cells (CD3 + CD8 +): 0.50 (95% CI 0.39–0.62; P = 0.89); B cells (CD19 +): 0.72 (95% CI 0.61–0.83; P < 0.041); NK cells (CD16 + CD56 +): 0.53 (95% CI 0.41–0.66; P = 0.52). (B) ROC analysis showing the performance of absolute counts of peripheral lymphocyte subsets in distinguishing 50% vaccine efficacy rates at timepoint-2; AUC for the subpopulation relative values: T helper cells (CD3 + CD4 +): 0.58 (95% CI 0.49–0.67; P = 0.05); T cytotoxic cells (CD3 + CD8 +): 0.57 (95% CI 0.48–0.65; P = 0.09); B cells (CD19 +): 0.64 (95% CI 0.56–0.72; P = 0.001); NK cells (CD16 + CD56 +): 0.51 (95% CI 0.42–0.59; P = 0.79). AUC, area under the curve; NK, Natural Killer; CI, confidence interval. Timepoint-1 denotes assessment before the third dose of tozinameran; timepoint-2 denotes assessment four weeks after the third dose of tozinameran; an antibody titer ≥ 50 AU/mL indicates a positive seroconversion response; antibody titer ≥ 4446 AU/ml was associated with 50% vaccine efficacy against a symptomatic COVID-19 infection.

