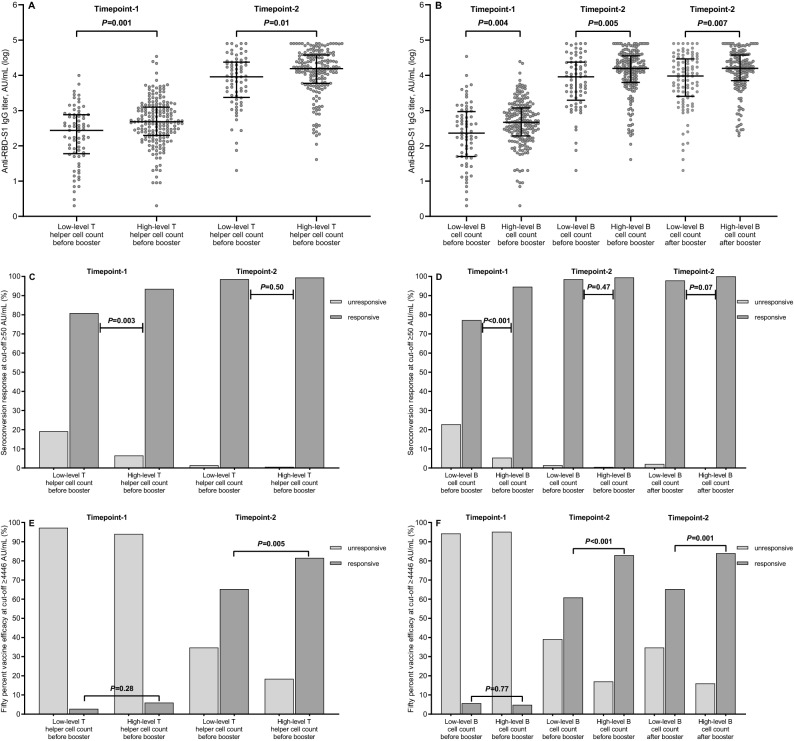
Figure 4.
Antibody response by level of lymphocyte subpopulation counts. (A) Comparison of scatter plot distributions and medians of antibody titers by level of T helper cell counts. (B) Comparison of scatter plot distributions and medians of antibody titers by level of B cell counts. (C) Comparison of seroconversion response rates by level of T helper cell counts. (D) Comparison of seroconversion response rates by level of B cell counts. (E) Comparison of 50% vaccine efficacy rates by level of T helper cell counts. (F) Comparison of 50% vaccine efficacy rates by level of B cell counts. Bars represent median values with 95% Confidence Intervals. Differences between groups were assessed using the Mann–Whitney U test (continuous variable) or the Pearson's χ2 test (categorical variables), as appropriate. A two-sided P value of < 0.05 was considered statistically significant. RBD-S1, receptor-binding domain (RBD) of the SARS-CoV-2 Spike protein (S1); AU, Arbitrary Unit; log, logarithmic values. Timepoint-1 denotes assessment before the third dose of tozinameran; Timepoint-2 denotes assessment four weeks after the third dose of tozinameran; an antibody titer ≥ 50 AU/mL indicates a positive seroconversion response; antibody titer ≥ 4446 AU/ml was associated with 50% vaccine efficacy against a symptomatic COVID-19 infection.

