FIGURE 5.
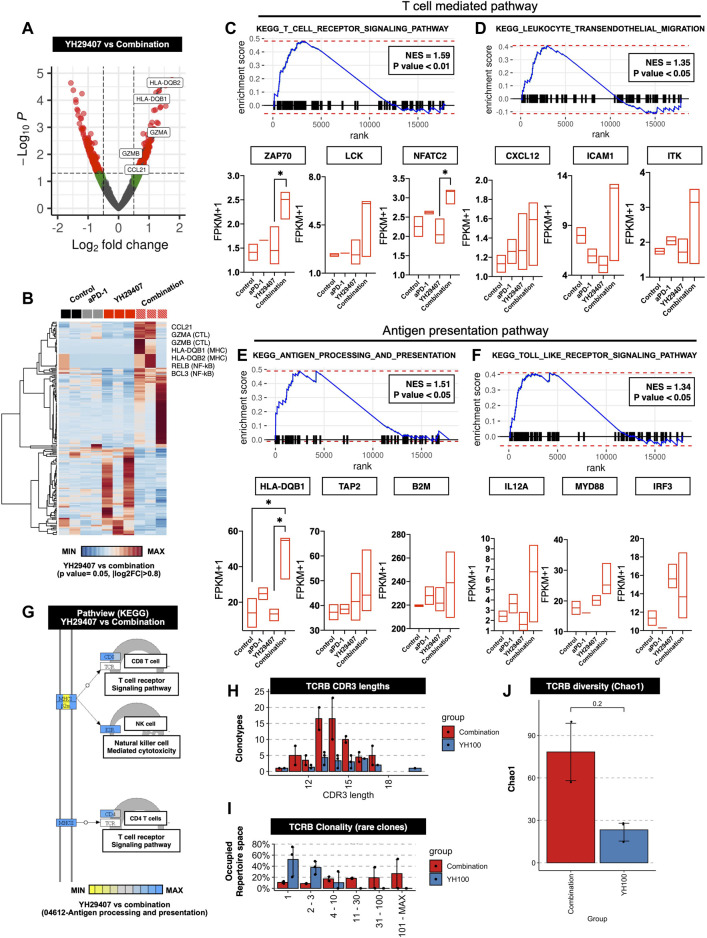
Differentially expressed genes (DEGs) and gene set enrichment analysis (GSEA) between the progression of YH29407+aPD-1 and other treatment groups. (A) Volcano plots of 17,871 genes used to compare DEGs in YH29407+aPD-1 and YH29407 treatment. DESeq2 package was used for folds of gene expression and statistical analysis (folds ≧|2|, p < 0.05). Individual gene expression and p values are displayed as colored dots (gray = non-significant and non-fold changes, green = folds >|2|, red = folds ≧|2|, and p < 0.05). Compared to YH29407 alone, lower expression of 138 genes and higher expression of 221 genes were identified in the YH29407+aPD-1 group. (B) Heatmaps show the core enrichment genes of each group. Gradient key color presents the expression of individual genes (Z-score normalized). (C–F) GSEA and KEGG pathway. Among the significant gene sets, T cell receptor signaling pathway, leukocyte transendothelial migration, antigen processing, and presentation and toll-like receptor signaling pathways are demonstrated with their normalized enrichment score (NES) and p value. (G) Pathview of KEGG pathway. (H) CDR3 length of TCR-beta analyzed by MiXCR and TcR analysis packages. (I) Rare clonality was expanded in the combination group. (J) TCRB diversity was increased in the combination group.

