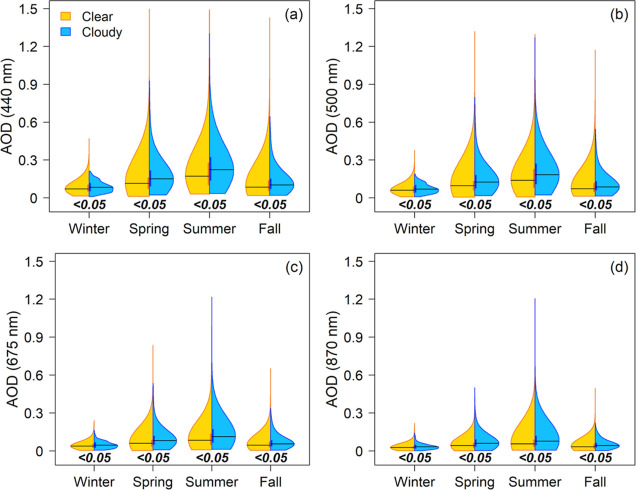
Figure 2.
Seasonal distributions from 2010 to 2019 of AOD at (a) 440, (b) 500, (c) 675, and (d) 870 nm on clear sky (gold) and cloudy (blue) days as binned by the AERONET quality assurance algorithm method. Vertical gold (clear sky) and blue (cloudy) bars represent the 25th to 75th quartile of each distribution, with the black horizontal line as the median. Black numbers are p-values from two-sided Mann–Whitney U tests, with bold italicized font indicating statistical significance between distributions where a p value < 0.05 indicates the two populations are not equal.

