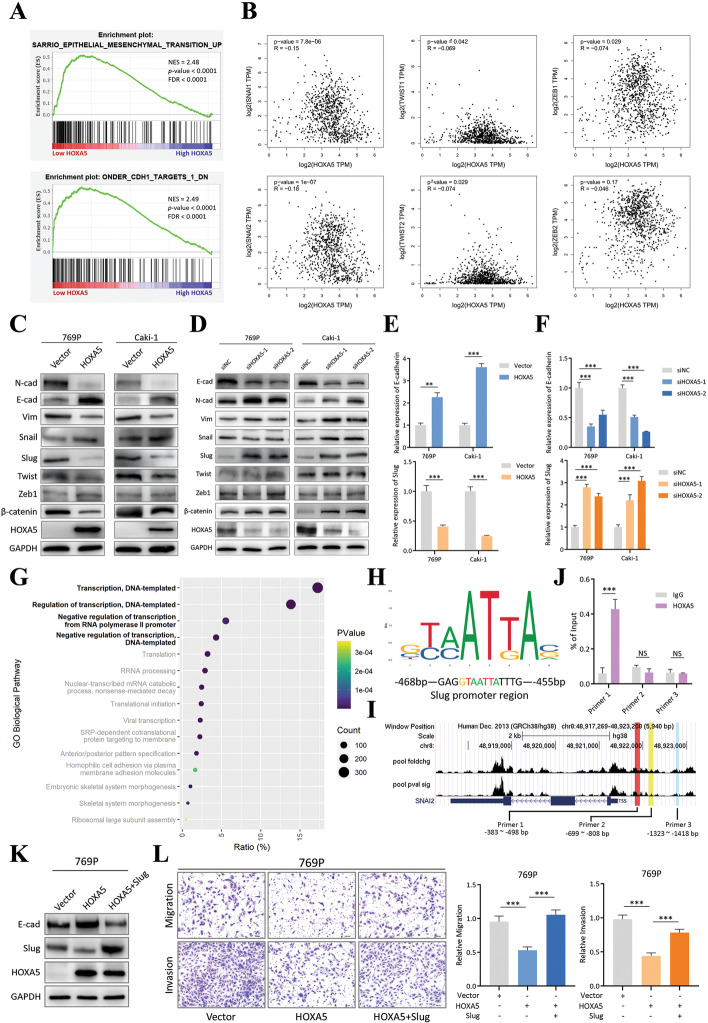
Fig. 6.
HOXA5 suppressed epithelial–mesenchymal transition (EMT) activation by downregulating SNAI2 (Slug). a. GSEA analysis on TCGA KIRC patient cohort (low HOXA5 vs. high HOXA5 patients, median expression as cut-off point). NES, normalized enrichment score; FDR, false discovery rate. b. Correlation analysis between HOXA5 and six EMT drivers (Snail, Slug, TWIST1, TWIST2, ZEB1, and ZEB2) in the TCGA KIRC dataset. Data was obtained from GEPIA website. c. Immunoblotting of several EMT drivers and markers in 769P and Caki-1 cells with control vector/HOXA5-overexpression. GAPDH was used as normalization control. d. Immunoblotting of several EMT drivers and markers in 769P and Caki-1 cells with control siNC/siHOXA5 siRNAs. GAPDH was used as normalization control. e. qRT-PCR quantification of E-cadherin and Slug in 769P and Caki-1 cells with control vector/HOXA5-overexpression. The control vector group was used as normalization. f. qRT-PCR quantification of E-cadherin and Slug in 769P and Caki-1 cells with control siNC/siHOXA5 siRNAs. The control siNC group was used as normalization. g. Bubble plot of GO biological pathway analysis on HOXA5-related genes. P value indicated the significance of the reported pathway. Count indicated how many HOXA5-related genes were involved in a particular pathway. Ratio indicated percentage of HOXA5-related genes in a particular pathway within the whole gene list. h Motif recognized by HOXA5, predicted by JASPAR transcription factor database (upper). Part of Slug promoter sequence (lower). Colored letters indicated sequence matching the HOXA5 motif. i. ChIP-seq dataset (GSE170384) visualization and primer design. j. ChIP-qPCR result of DNA fragments pulled-down by Flag antibody in Flag-HOXA5 overexpression 769P cells. Non-specific IgG was used as control. Primer 1, 2 and 3 were specific to different region of Slug promoter. k. Immunoblotting of HOXA5-Slug salvage experiment. 769P cells were first transfected with HOXA5-overexpression plasmid, followed by Slug-overexpression plasmid. GAPDH was used as normalization control. l. Transwell assay of the 769P HOXA5-Slug salvage experiment. Representative images (left) and quantification (right) data were showed. Data are mean ± SD, n = 3

