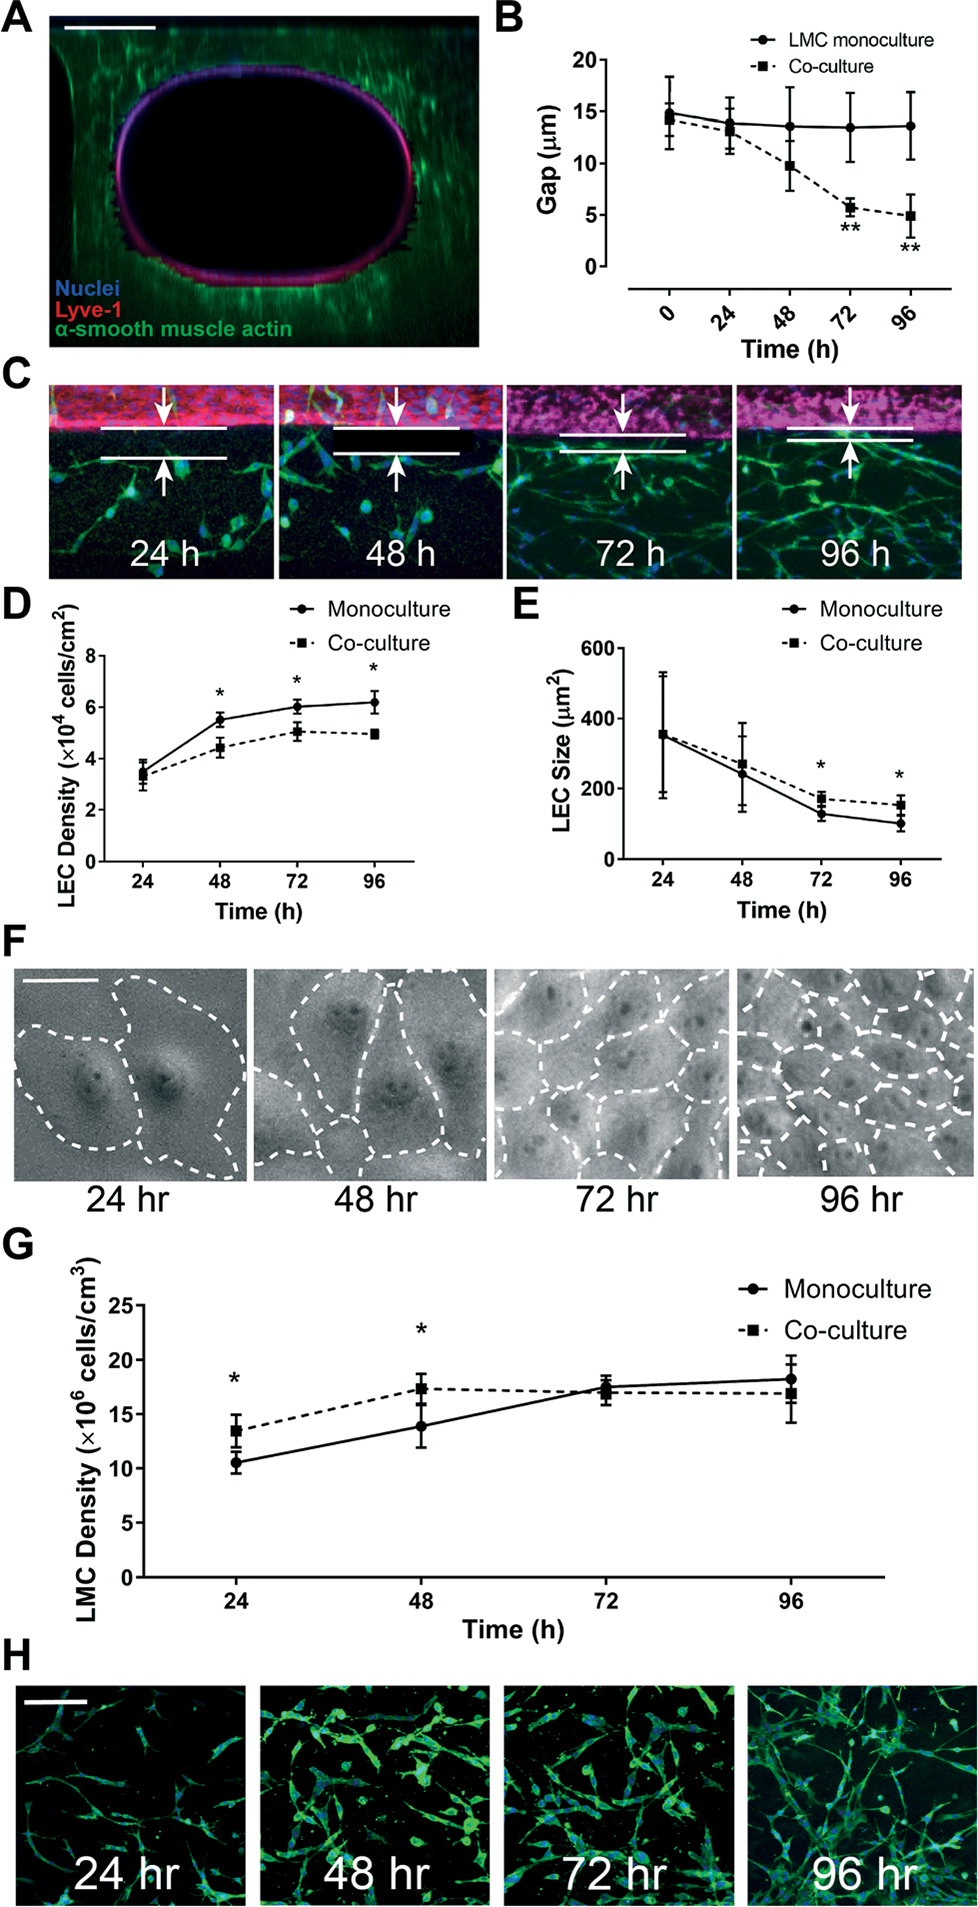
Fig. 5.

Assessment of lymphatic endothelial and muscle cells within the lymphangion-chip. (A) Confocal cross-sectional image showing LECs (red) surrounded by LMCs (green); scale bar: 200 μm. (B) The average gap distance between endothelium and muscle layers over 96 hours after cell culture, shown graphically, and (C) via representative images of LECs (red) and LMCs (green); scale bar: 20 μm. (D) LMC density and (E) size vs. time either in monoculture (solid line) or co-culture with LMCs (dotted line). (F) Representative images of LECs showing an increase in cell density and decrease in cell size when cultured on-chip; scale bar: 50 μm. (G) Graph and (H) representative images of LMC (green) density in the 3D ECM in monoculture versus co-culture; scale bar: 50 μm; *p < 0.05, **p < 0.005; n = 5–7 for all experiments.
