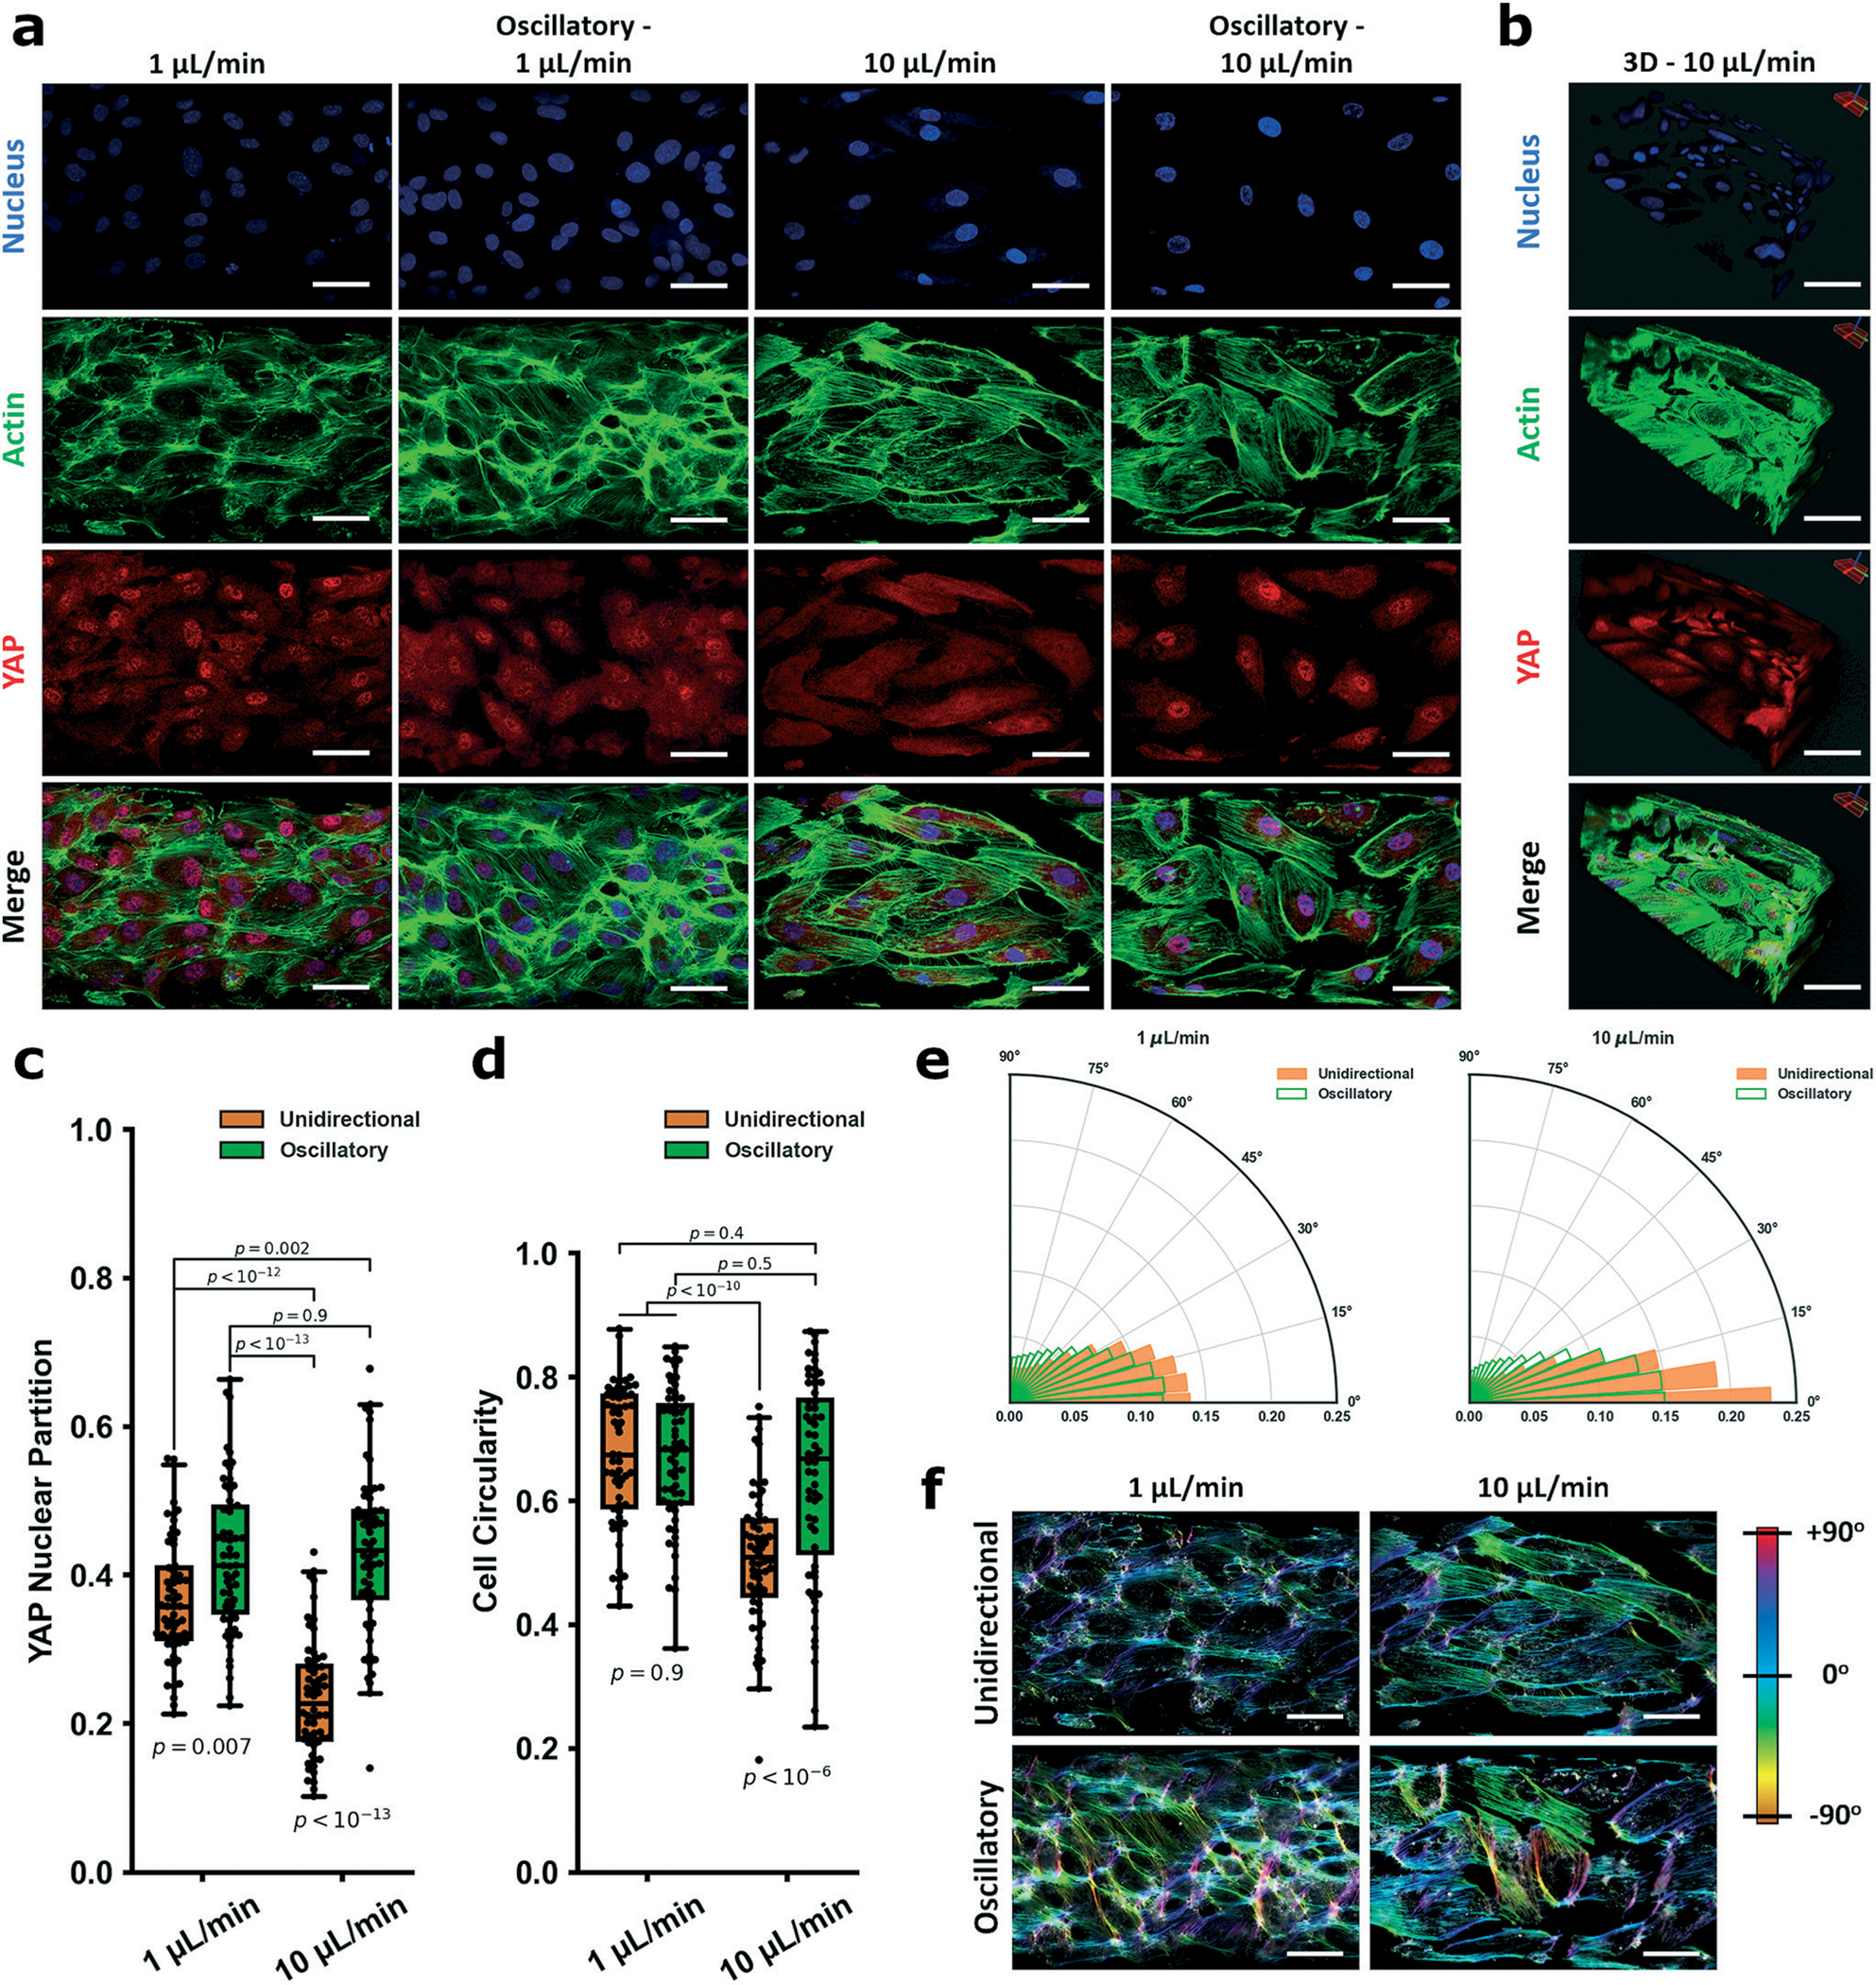
Fig. 2.

YAP mechanobiological model validation of the vessel-chip system for studying endothelial mechanobiology. In a are representative fields of view within the vessel-on-a-chip device for 1 μL min−1, oscillatory 1 μL min−1, 10 μL min−1, and oscillatory 10 μL min−1 flow. Cells were stained for nuclei (DAPI, blue), actin (phalloidin, green,) and YAP (red). Oscillatory flow was induced by alternating between withdrawal (2 seconds) and infuse (1 second). b Is a Z-stack image of a section of a vessel-on-a-chip showing lumen formation (10 μL min−1). Scale bars in a and b are all 50 μm. YAP partitions for each group are: 1 μL min−1: 0.37 ± 0.08; oscillatory 1 μL min−1: 0.42 ± 0.1; 10 μL min−1: 0.23 ± 0.08; oscillatory 10 μL min−1: 0.43 ± 0.11 (c). The cellular morphology (circularity) is quantified in d. Circularity is defined as 4π(area/perimeter2) and is valued from 0 to 1. Indices closer to 1 indicate more circular cell morphology, while elongated cells have indices closer to 0. CSI measured for the flow fields are: 1 μL min−1: 0.67 ± 0.11; oscillatory 1 μL min−1: 0.67 ± 0.11; 10 μL min−1: 0.51 ± 0.11; oscillatory 10 μL min−1: 0.64 ± 0.16. Directionality assays based on actin alignment detailing how HUVECs align along the flow vector within the fluidic chamber under the different shear regimens/patterns are shown in e. Data is visualized in the form of (r, θ) – r is the normalized density of actin filaments aligned at each angle, θ. Higher values of r for a given θ indicate increasing alignment. For 10 μL min−1, HUVECs aligned strongly along the flow vector, while the effect was evident but not as strong in the 1 μL min−1 regime. HUVECs in both oscillatory flow fields showed a markedly decreased alignment distribution around the flow vector. Color maps showing the gradient of actin alignment (from the representative actin images in a) are visualized in f using OrientationJ. For YAP partition experiments and CSI experiments, n = 60 cells. Alignment polar histogram plots are comprised of an average of 5–6 fields of view, directionality calculated from 0° to 90° binned 15 times in ImageJ. Statistics performed using a single factor ANOVA with post hoc Tukey’s test for significance. Each p-value between groups is reported natively as calculated, significance taken at p < 0.05. All values reported as mean ± standard deviation.
