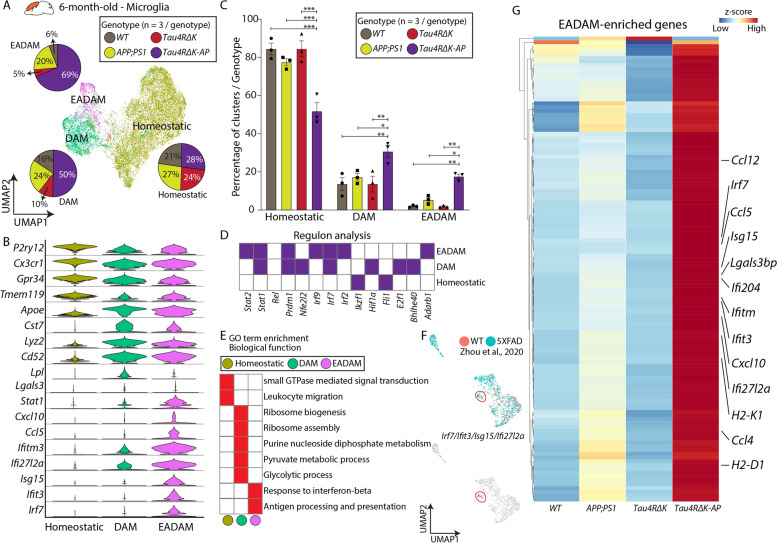
Fig. 1.
The microglia subtype EADAM is observed in the Tau4RΔK-AP mice in the 6-month-old cortex. A UMAP plot showing microglia clusters—Homeostatic, DAM, and EADAM, across 4 genotypes in 6-month-old cortex (n = 3/genotype), and pie graphs showing the distribution of 3 microglia clusters across genotypes (n = 3/genotype). B Violin plots showing top cluster genes of 3 microglia clusters. C Bar graphs showing the distribution of 3 microglia clusters within each genotype (n = 3/genotype). Note the significant increase in the EADAM cluster in Tau4RΔK-AP mice. D Regulon analysis with SCENIC [40], showing key regulons in each microglia cluster. E GO analysis of top differential genes reveals a biological function in each microglial cluster. F UMAP plots of 7-month-old 5XFAD mice in Zhou et al. 2020 [23] (top) and a small cluster of cells (red circle) expressing a few EADAM-enriched markers (bottom). G Heatmap showing expression of EADAM-enriched genes across genotypes. * P < 0.05, ** P < 0.005, *** P < 0.0001

