Fig. 4.
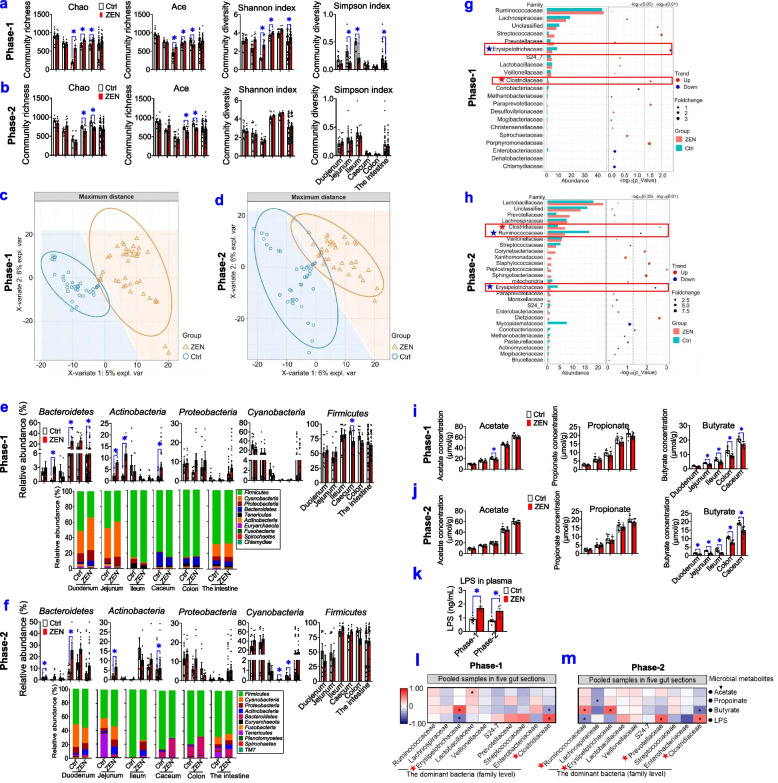
ZEN-induced toxicity alters gut microbial metabolites. a, b The community richness (Chao and ACE index) and community diversity (Shannon and Simpson index) in all five gut sections, including the duodenum, jejunum, ileum, caecum, and colon of pigs, during phase-1 (a) and phase-2 (b), between the Ctrl group and ZEN group (n=8). c, d The PLS-DA score plots of phase-1 pigs (c) and phase-2 pigs (d) between the Ctrl group and ZEN group (n=40, pooled samples in five gut sections). e, f Bacterial compositions at the phylum level and its dominant bacterial phyla (relative abundance > 1.00%) of all five gut sections of phase-1 pigs (e) and phase-2 (f) pigs that were exposed to ZEN (n=8). g, h Differential abundance analysis of gut bacteria (at the family level) in pigs (n=40, pooled samples in five gut sections). The bar plot on the left shows the top 20 most abundant bacteria. The bubble plot on right displays its Wilcox test results. i, j The concentrations of short-chain fatty acids (SCFAs) in all five gut sections (n=8). k The levels of plasma lipopolysaccharides (LPS) in pigs (n=8). l, m Spearman’s correlation coefficients between core bacteria (at the family level) and major microbial metabolites, including SCFAs and LPS. Bar values are means ± SEM. *P < 0.05

