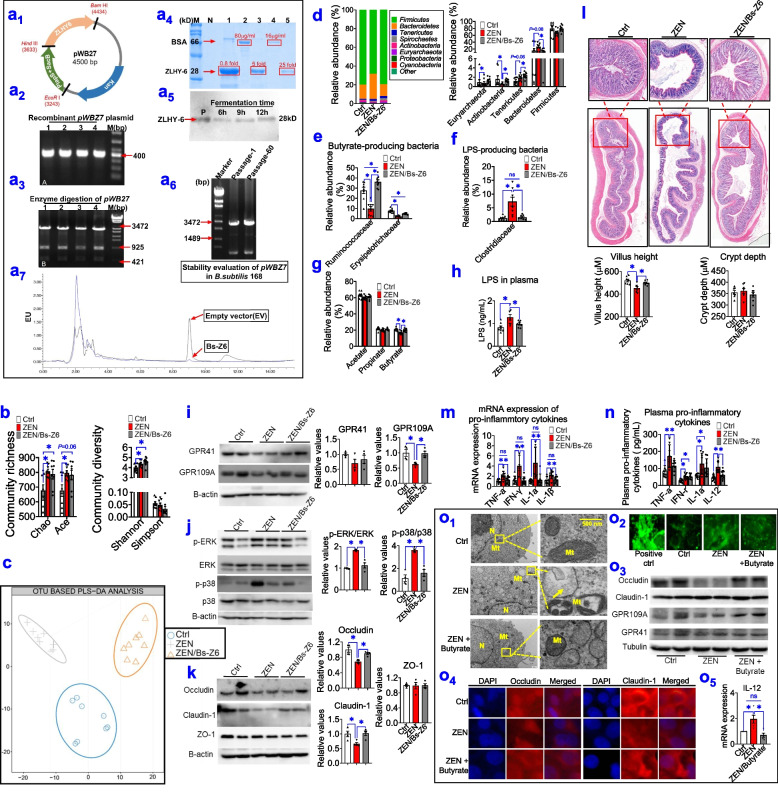
Fig. 6.
Modified gut microbial metabolites by engineering ZEN-degrading enzyme ZLHY-6 counteracts ZEN-induced toxicity on intestinal barrier function. a Generation of recombinant B. subtilis-expressing ZLHY-6 (the Bs-Z6 strain) and its degradation effect on ZEN-contaminated food. a1–3 Construction and its identification of the recombinant expression vector-pWBZ7 containing ZLHY-6 gene (a1). a2–3 The PCR identification and its double enzyme digestion of positive transformants of the recombinant Bs-Z6 strain. Lanes 1-4: positive transformants; M: DNA marker. a4 SDS-PAGE electrophoresis analysis of purified ZLHY-6 in recombinant Bs-Z6 strain. M: protein ladders; Lanes 1, 3, 5: 0.8, 5, 25-fold target protein purification samples, respectively. Lanes 2, 4: 80μg/mL, 16μg/mL BSA, respectively. a5 SDS-PAGE electrophoresis of recombinant ZLHY-6 protein expressed in Bs-Z6 at different fermentation duration (6, 9, 12 h). a6 Stability evaluation of pWBZ7 in the recombinant Bs-Z6 strain. Lanes 1, 2: Enzyme digestion of pWBZ7 plasmid from the first and 60th generation of this recombinant strain, respectively. M: DNA ladder. a7 The degradation activity of ZEN detected by HPLC for the genetic engineering strains. b The community richness (Chao and ACE index) and community diversity (Shannon and Simpson index) in the colon of phase-3 pigs among the control (Ctrl), zearalenone (ZEN), ZEN supplemented with recombinant Bs-Z6 strain (Bs-Z6) groups (n=8). c Analysis of PLS-DA score plots (n=8). d Bacterial compositions at the phylum level and its dominant bacterial phyla (relative abundance > 1%). e, f Differential abundance analysis of potential butyrate-producing bacteria and LPS-producing bacteria (at the family level) (n=8). g The concentrations of SCFAs in the colon. h The levels of plasma LPS. i–k Representative Western blots and its quantification of SCFAs receptors (GPR109A and GPR41), the ERK1/2 and p38 signalling pathway, and tight junction markers (occludin, claudin-1, and ZO-1) in the colon (n=4). The B-actin is used as the loading control (n=4). l Representative light micrographs of a cross-section of the colon under ×40 magnification and its quantification of villus height, crypt depth (n=8). Scale bar represents 200 μm. m, n The mRNA expression (m) and plasma concentrations (n) of pro-inflammatory cytokines (n=8). o Butyrate supplementation reduces ZEN-induced toxicity on intestinal barrier in porcine intestinal epithelial cell (IPEC-J2). o1 Representative TEM images of IPEC-J2 cells from each group (The arrows show swelling nucleus and/or mitochondria). The scale bar represents 500 nm. o2 Representative confocal microscope images of oxidative stress marker ROS content) of IPEC-J2 cells. o3–4 Representative Western blots and confocal microscope images of tight junction markers (occludin and claudin-1) (n=3). o5 The mRNA expression of pro-inflammatory cytokines (e.g., IL-12) (n=4). Bar values are means ± SEM. *P < 0.05

