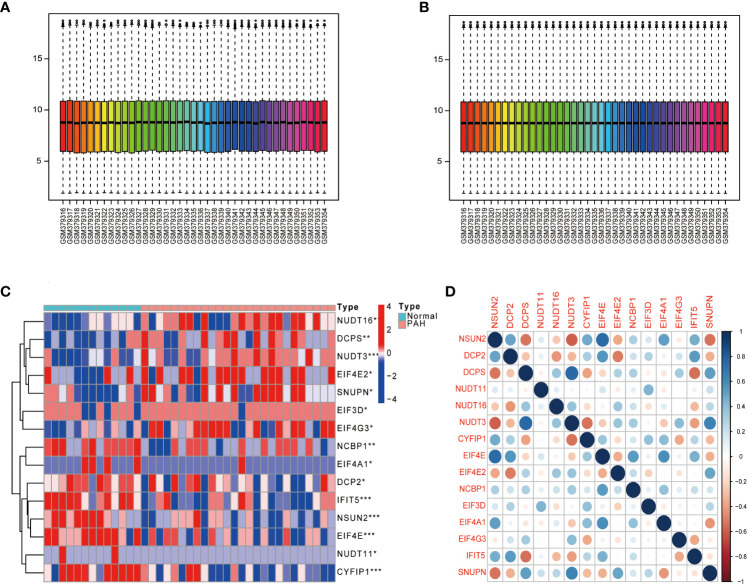
Figure 1.
Gene differential expression analysis. (A) GSE15197 data before normalization. (B) GSE15197 normalized data. (C) Differential expression of m7G-regulated genes in PAH patients and normal controls. (D) Heat map of the correlation of m7G genes. Both horizontal and vertical coordinates represent genes, and different colors represent correlation coefficients (blue represents positive correlation and red represents negative correlation in the diagram). *P < 0.05, **P < 0.01 and ***P < 0.001. asterisks (*) stand for significance levels.

