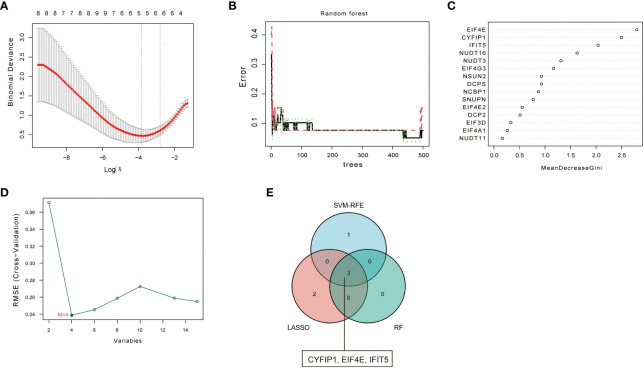
Figure 2.
Screening of disease signature genes. (A) Selection of the best Log (ʎ) value for LASSO regression. The x-axis represents the Log (ʎ) value, and the y-axis represents the error rate of cross-validation errors. (B) The influence of the number of decision trees on the error rate. The x-axis repre- sents the number of decision trees, and they-axis indicates the error rate. (C) Results of the Ginico efficient method in random forest classifier. The x-axis indicates the genetic variable, and the y-axis represents the importance index. (D) Variation curve of gene cross-validation error in SVM-RFE algorithm. (E) Venn diagram showing 3 disease signature genes shared by LASSO, SVM-RFE and RF arithmetic methods.

