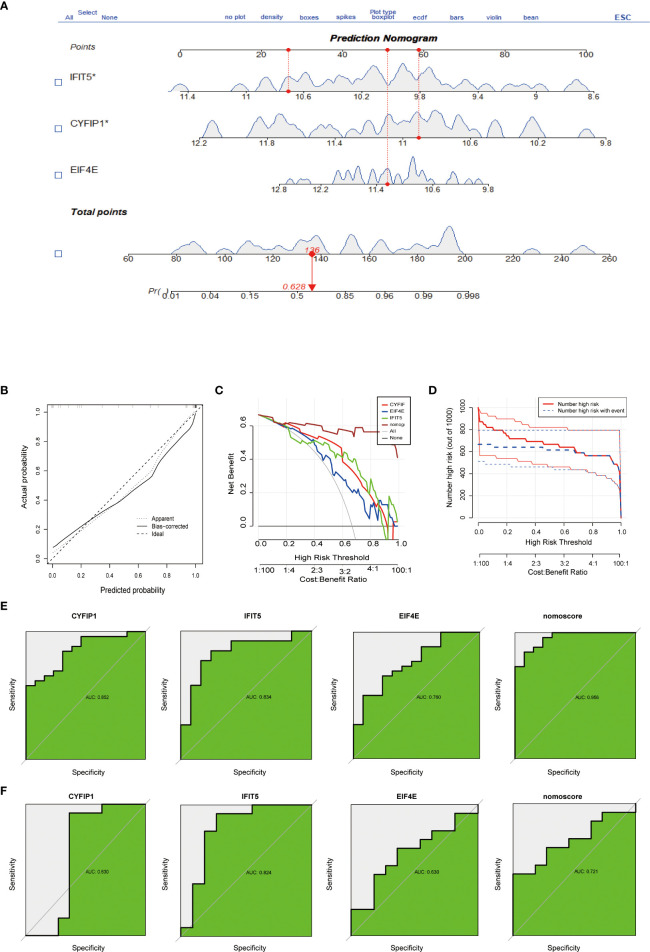
Figure 3.
Construction and evaluation of a nomogram model for PAH diagnosis. (A) Nomogram model used to predict the incidence of PAH. (B) The calibration curve was used to assess the ability of the Nomo score model to predict. (C) The clinical value of the Nomo score model assessed by the decision curve. (D) Evaluation of the clinical impact curve of the Nomo score model based on the decision curve. (E) ROC curves of CYFIP1, EIF4E, IFIT5 and Nomo score in the GSE15197 dataset. (F) CYFIP1, EIF4E, IFIT5 and Nomo score ROC curve validation results in the GSE113439 validation set, AUC value is the area under the ROC curve.

