Figure 4.
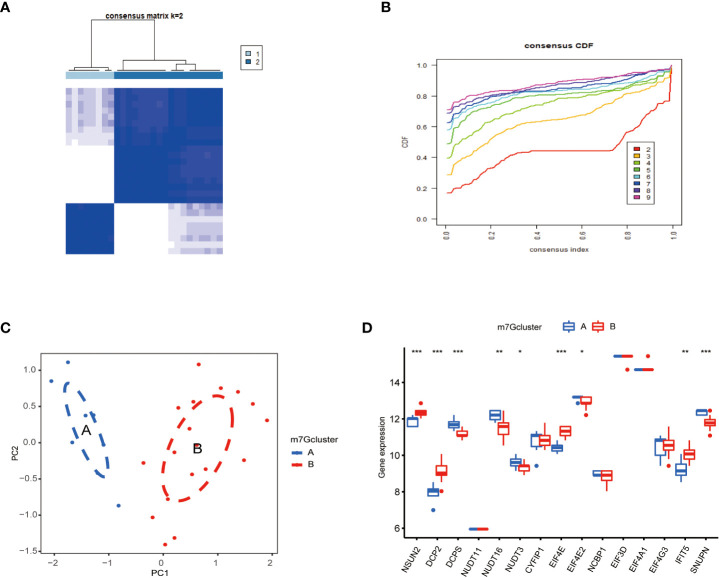
Consistent clustering of m7G genes. (A) Consistency of clustering results heatmap (k = 2). (B) Consensus cluster cumulative distribution function curve(k=2). (C) PCA analysis. Different colors represent different groups. As shown in the diagram, groups A and B are separated without any intersection. (D) Expression of 15 kinds of m7G regulators in Cluster. The abscissa represents m7G differential gene, and the ordinate represents the expression distribution of this related gene. *P < 0.05, **P < 0.01, and ***P < 0.001.

