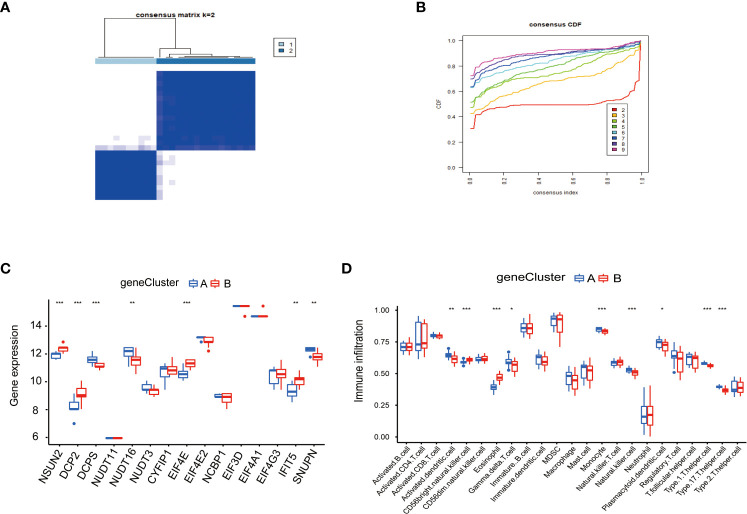
Figure 6.
Consensus clustering of genes in PAH. (A) Consistency of clustering results heatmap (k=2). (B) Consensus cluster cumulative distribution function curve (k=2). (C) Expression of 15 kinds of m7G regulators in the gene Cluster. (D) Expression of immune cells in the gene Cluster. *P < 0.05, **P < 0.01, and ***P < 0.001.

