
Fig. 1. Metabolic stress in Ob/Ob mice and mice on high-fat and high-fructose diet affects the DC proteome.
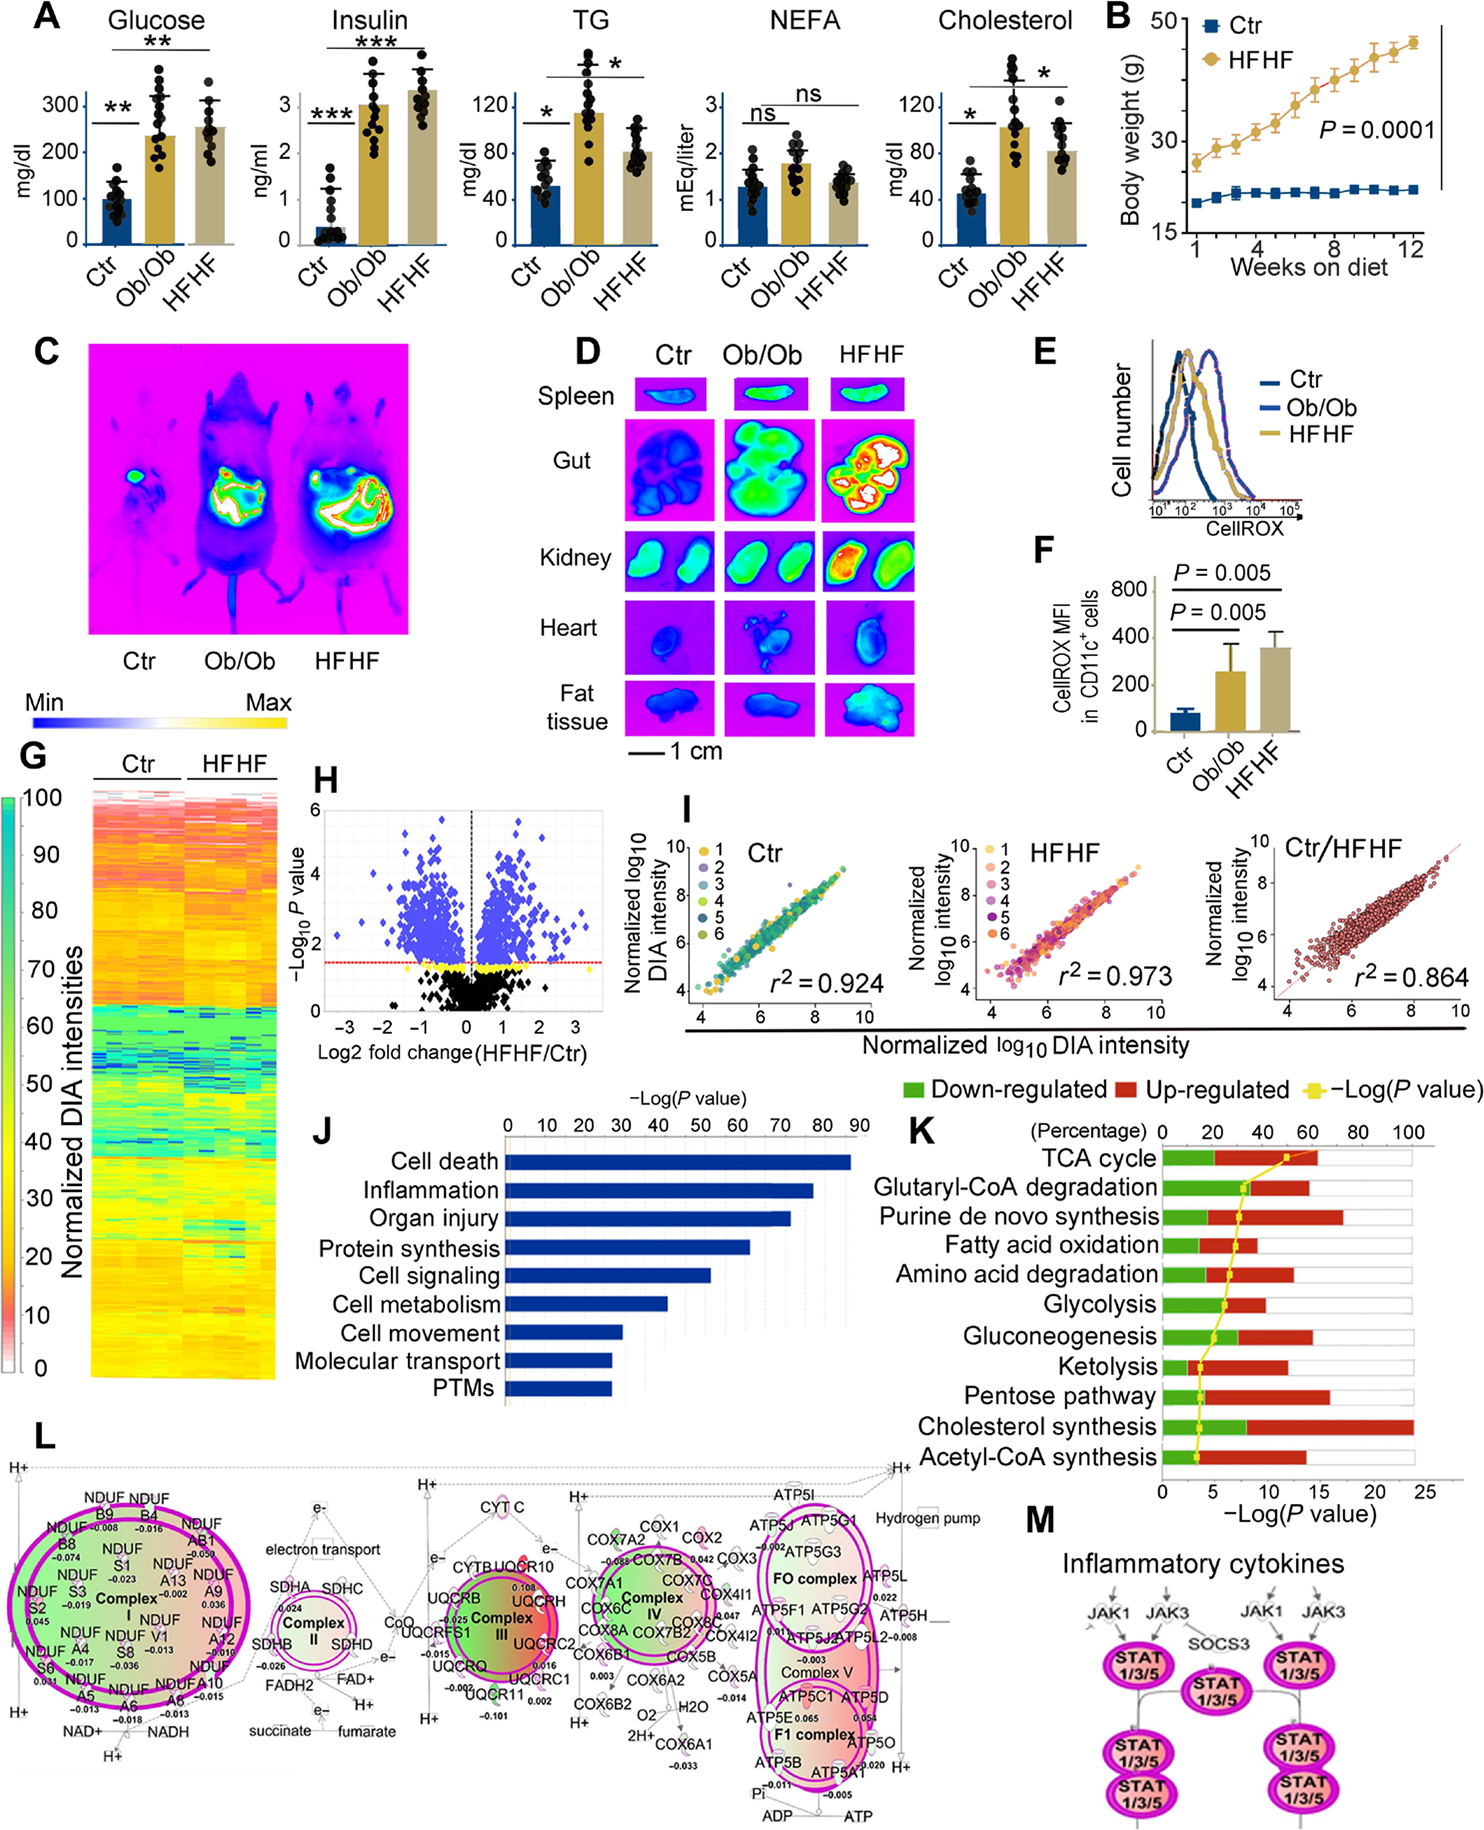
(A) Plasma concentrations of glucose, insulin, triglycerides (TG), nonesterified fatty acids (NEFA), and cholesterol in B6 (control), Ob/Ob mice, and B6 mice kept for 3 months on an HFHF diet. Each dot represents one biological sample. Values, from n = 14 biologically independent replicates, are reported as mean relative expression ± SD and were statistically analyzed using a two-tailed paired Student’s t test. Significance levels are reported as *P < 0.05, **P < 0.01 and ***P < 0.001. ns, nonsignificant. (B) Chart representing weight gain over a 3-month period in mice kept on a regular diet or HFHF diet. Values, from n = 14 biologically independent replicates, are reported as mean relative expression ± SD and were statistically analyzed using a two-tailed paired Student’s t test. (C) In vivo imaging of B6 (control), Ob/Ob, and HFHF mice using the In Vivo F PRO imaging system after intravenous injection with the oxidative stress detection reagent CellROX (excitation, 640 nm; emission, 664 nm). (D) Ex vivo imaging of spleen, gut, kidney, heart, and fat tissue samples collected from CellROX intravenously injected animals, imaged with the In Vivo F PRO imaging system. Samples were imaged for 3 min at excitation 610 nm/emission 700 nm using a built-in cooled charge-coupled device camera. Fluorescence intensity scale ranges from pink (lowest level) to red (highest level). (E) Representative fluorescence-activated cell sorting analysis of CellROX staining on CD11c+ DCs from the spleens of control, Ob/Ob, and HFHF mice, previously injected with CellROX as detailed in (C). (F) Bar graph of the MFI of CellROX as detected in CD11c+ DCs from the spleens of control, HFHF, and Ob/Ob mice; average and SD from four biological replicates (fig. S1). Values, from n = 6 biologically independent replicates, are reported as mean relative expression ± SD and were statistically analyzed using a two-tailed paired Student’s t test. (G) LFQ analysis of changes in the protein expression profiles induced by HFHF diet in primary murine DCs. The proteome was analyzed by nano-LC DIA, and the heatmap was generated in Scaffold DIA using the normalized DIA intensities. The normalized DIA intensities are summed over all identified and validated peptides from each protein group and are proportional to the relative abundance of each protein. A total of 948 target proteins were identified (0.9% FDR) across all 12 biological replicates from proteomic extracts of DCs from B6 on regular or HFHF diet, having at least three unique peptides (0.3% FDR). The complete proteomic dataset (including a total of 1487 proteins identified at a 2% FDR for proteins and 0.5% FDR for peptides) is presented in table S1. (H) Volcano plot generated using the normalized total DIA intensities from the proteomics data derived from n = 6 biological control and HFHF replicates depicts the proteins that are up- or down-regulated in HFHF mice as compared with controls. LFQ DIA analysis identified 902 differently expressed proteins (P < 0.027 for green and 0.05 > P > 0.027 for yellow hits, respectively, by ANOVA/t tests with Benjamini-Hochberg correction). (I) Regression analysis of normalized DIA intensities for the 948 target proteins (identified with FDR < 1% and at least three unique peptides) in the murine DC proteomes from HFHF and controls. The Pearson’s correlation score (0.92 and 0.97, respectively) indicates the high reproducibility among the proteomes extracted from DCs of mice on either HFHF or normal diet. In contrast, the differential proteomic expression profiles among the replicates from HFHF and regular diet murine DCs are reflected by a lower Pearson coefficient (r2 = 0.864). (J) IPA of the top-scoring cellular and physiological pathways, derived from the proteins with differential expression profiles between control and HFHF mice. IPA identified significant cellular and molecular functions (P < 0.05 by Fisher’s exact test with Benjamini-Hochberg correction) associated with the inflammatory reaction, organ injury, and metabolic changes present in the HFHF group as compared with controls. (K) Analysis of the pathways associated with the proteins undergoing significant fold changes, based on LFQ DIA analysis presented in (H) and (I). The IPA-mediated quantitative analysis indicates for each pathway the percentage of proteins that are up-regulated (red) or down-regulated (green) in HFHF mice as compared with controls. Metabolic pathways [tricarboxylic acid (TCA), glycolysis, amino acid degradation, and fatty acid oxidation, among others] are the most affected by the HFHF diet. (L) IPA-generated analysis displaying mitochondrial oxidative phosphorylation and the associated macromolecular complexes affected by the HFHF diet. (M) IPA-generated analysis of the Janus kinase (JAK)/signal transducer and activator of transcription (STAT) pathway(s) up-regulated in the HFHF group as compared with controls. Green colors depict proteins down-regulated, whereas red colors depict proteins up-regulated in the HFHF versus control mice. The color intensity directly correlates with fold changes, expressed as log2 (HFHF/control normalized DIA ratios). The complete proteomic dataset and IPA analysis are presented in tables S1 and S4.