
Fig. 3. Increased MHC-II presentation of peptides derived from metabolic stress–associated proteins including PDIA3.
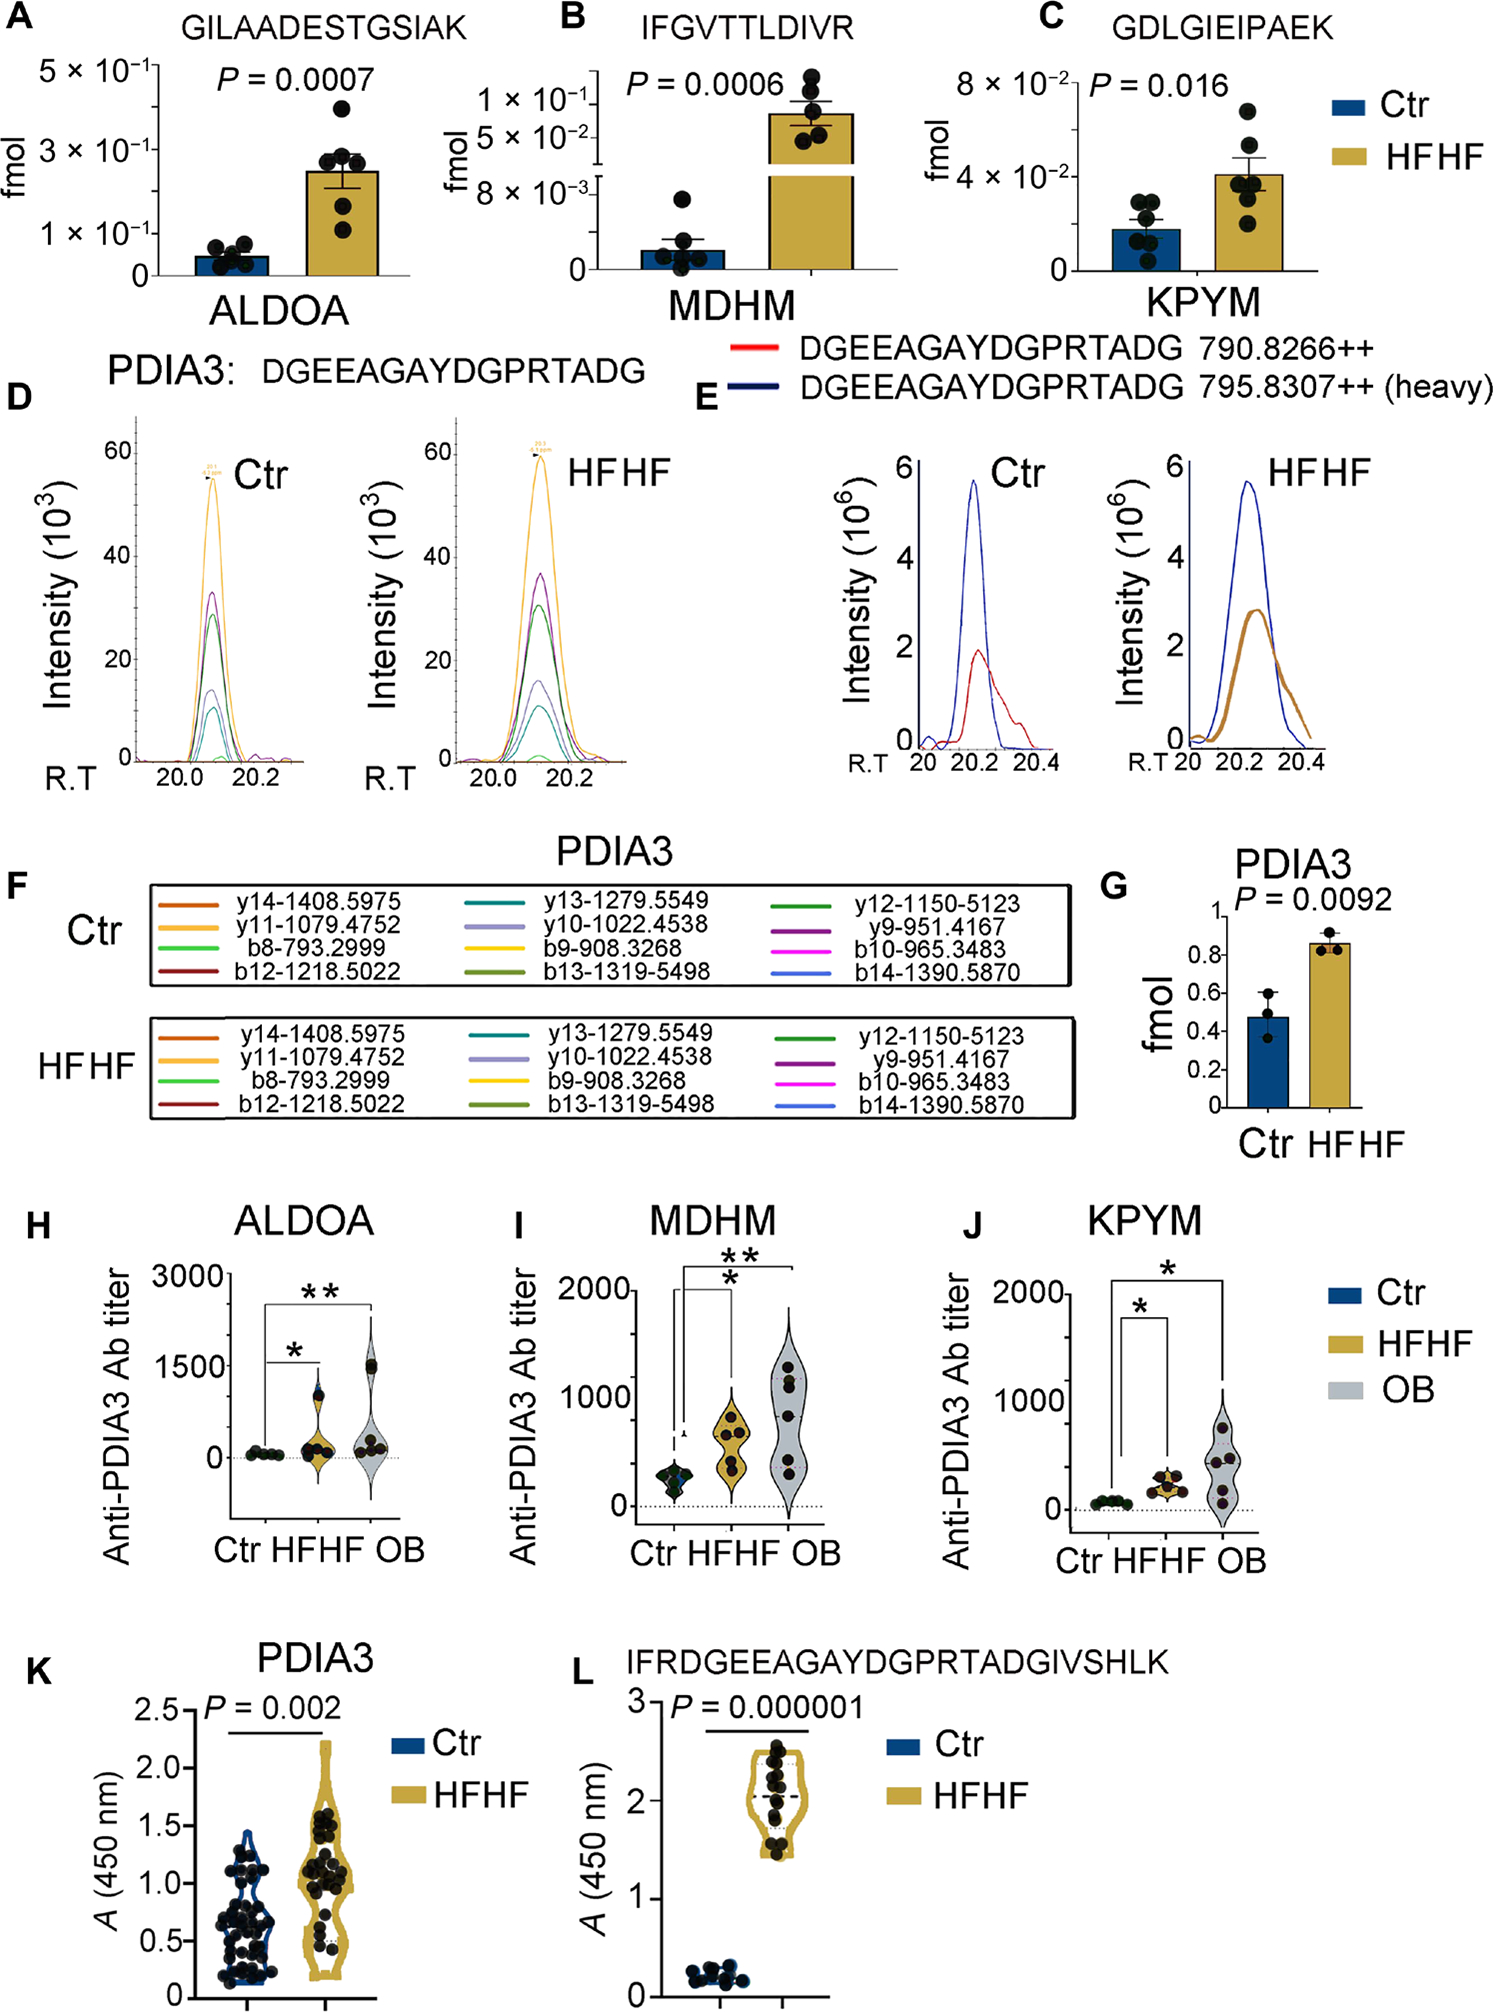
(A to C) MS-based PRM for quantitative analysis of selected endogenous peptide epitopes derived from glycolytic enzymes (ALDOA, MDHM, and KPYM) in the eluted peptidomes of liver immune infiltrates from mice on a control or HFHF diet. Values from n = 6 biologically independent replicates are reported as mean relative expression ± SD. Values were statistically analyzed using two-tailed unpaired Student’s t tests. Significance levels are reported as *P < 0.05 and **P < 0.01. The complete transition list associated with the heavy and light (endogenous) peptides is presented in table S3. (D) Skyline-extracted MS2 (y and b ions) from MS-based PRM for absolute quantitation of the endogenous PDIA3 peptide, DGEEAGAYDGPRTADG, after spiking the I-Ab immunopeptidome samples of control and HFHF eluates with 2 fmol of heavy-labeled PDIA3 DGEEAGAYDGPR[+10]TADG. (E) Representative ion-extracted chromatogram of the MS1 precursors corresponding to the identified MS2 ions shown in the left panel: The spiked heavy peptide PDIA3 DGEEAGAYDGPR[+10]TADG is shown in blue, and the corresponding endogenous light peptide is shown either in red (control diet) or in blue (HFHF diet), coeluting in both cases with the heavy standard. (F) MS2-extracted monoisotopic peaks corresponding to the b and y fragment ions resulted from the fragmentation of the PDIA3 peptide DGEEAGAYDGPRTADG and analyzed by the PRM method. (G) PRM-derived quantitative analysis of endogenous DGEEAGAYDGPRTADG in the I-Ab immunopeptidome eluate samples from control and HFHF mice. Values, from n = 6 biologically independent replicates, are reported as mean relative expression ± SD. Values were statistically analyzed using a two-tailed unpaired Student’s t test. Significance levels are reported as *P < 0.05. The complete transition list associated with the heavy and light (endogenous) peptides is presented in table S3. (H to J) Violin plots depicting antibody (Ab) titers against MDHM, ALDOA, and PYKM using mouse recombinant proteins and ELISA assays performed on serially diluted sera collected from control and HFHF or OB (Ob/Ob) mice. Values, from n = 5 biologically independent replicates, are reported as mean relative abundance ± SD. Values were statistically analyzed using one-way analysis of variance (ANOVA) Kruskal-Wallis test for multiple comparison followed by uncorrected Dunn’s test. Significance levels are reported as *P < 0.05 and **P < 0.01. (K) Violin plot depicting the amount of autoantibodies against full-length PDIA3 protein using mouse recombinant protein and ELISA assays performed on 1:500 diluted sera collected from control and HFHF mice. Values, from n = 41 (control) and 36 (HFHF) biologically independent replicates, are reported as mean relative abundance. Each dot symbol is an average of technical quadruplicates. Values were statistically analyzed using a two-tailed unpaired Student’s t test. Significance levels are reported as **P < 0.01. (L) Violin plot depicting amounts of autoantibodies against a linear B cell PDIA3 epitope (IFRDGEEAGAYDGPRTADGIVSHLK). ELISA assays were performed on 1:100 diluted sera collected from control and HFHF mice. Values, from n = 10 (control) and 14 (HFHF) biologically independent replicates, are reported as mean relative abundance. Each dot symbol is an average of technical quadruplicates. Values were statistically analyzed using a two-tailed unpaired Student’s t test. Significance levels are reported as P < 0.0001.