
Fig. 5. High-fat and high-fructose diet induces PDIA3 antibody–mediated liver damage.
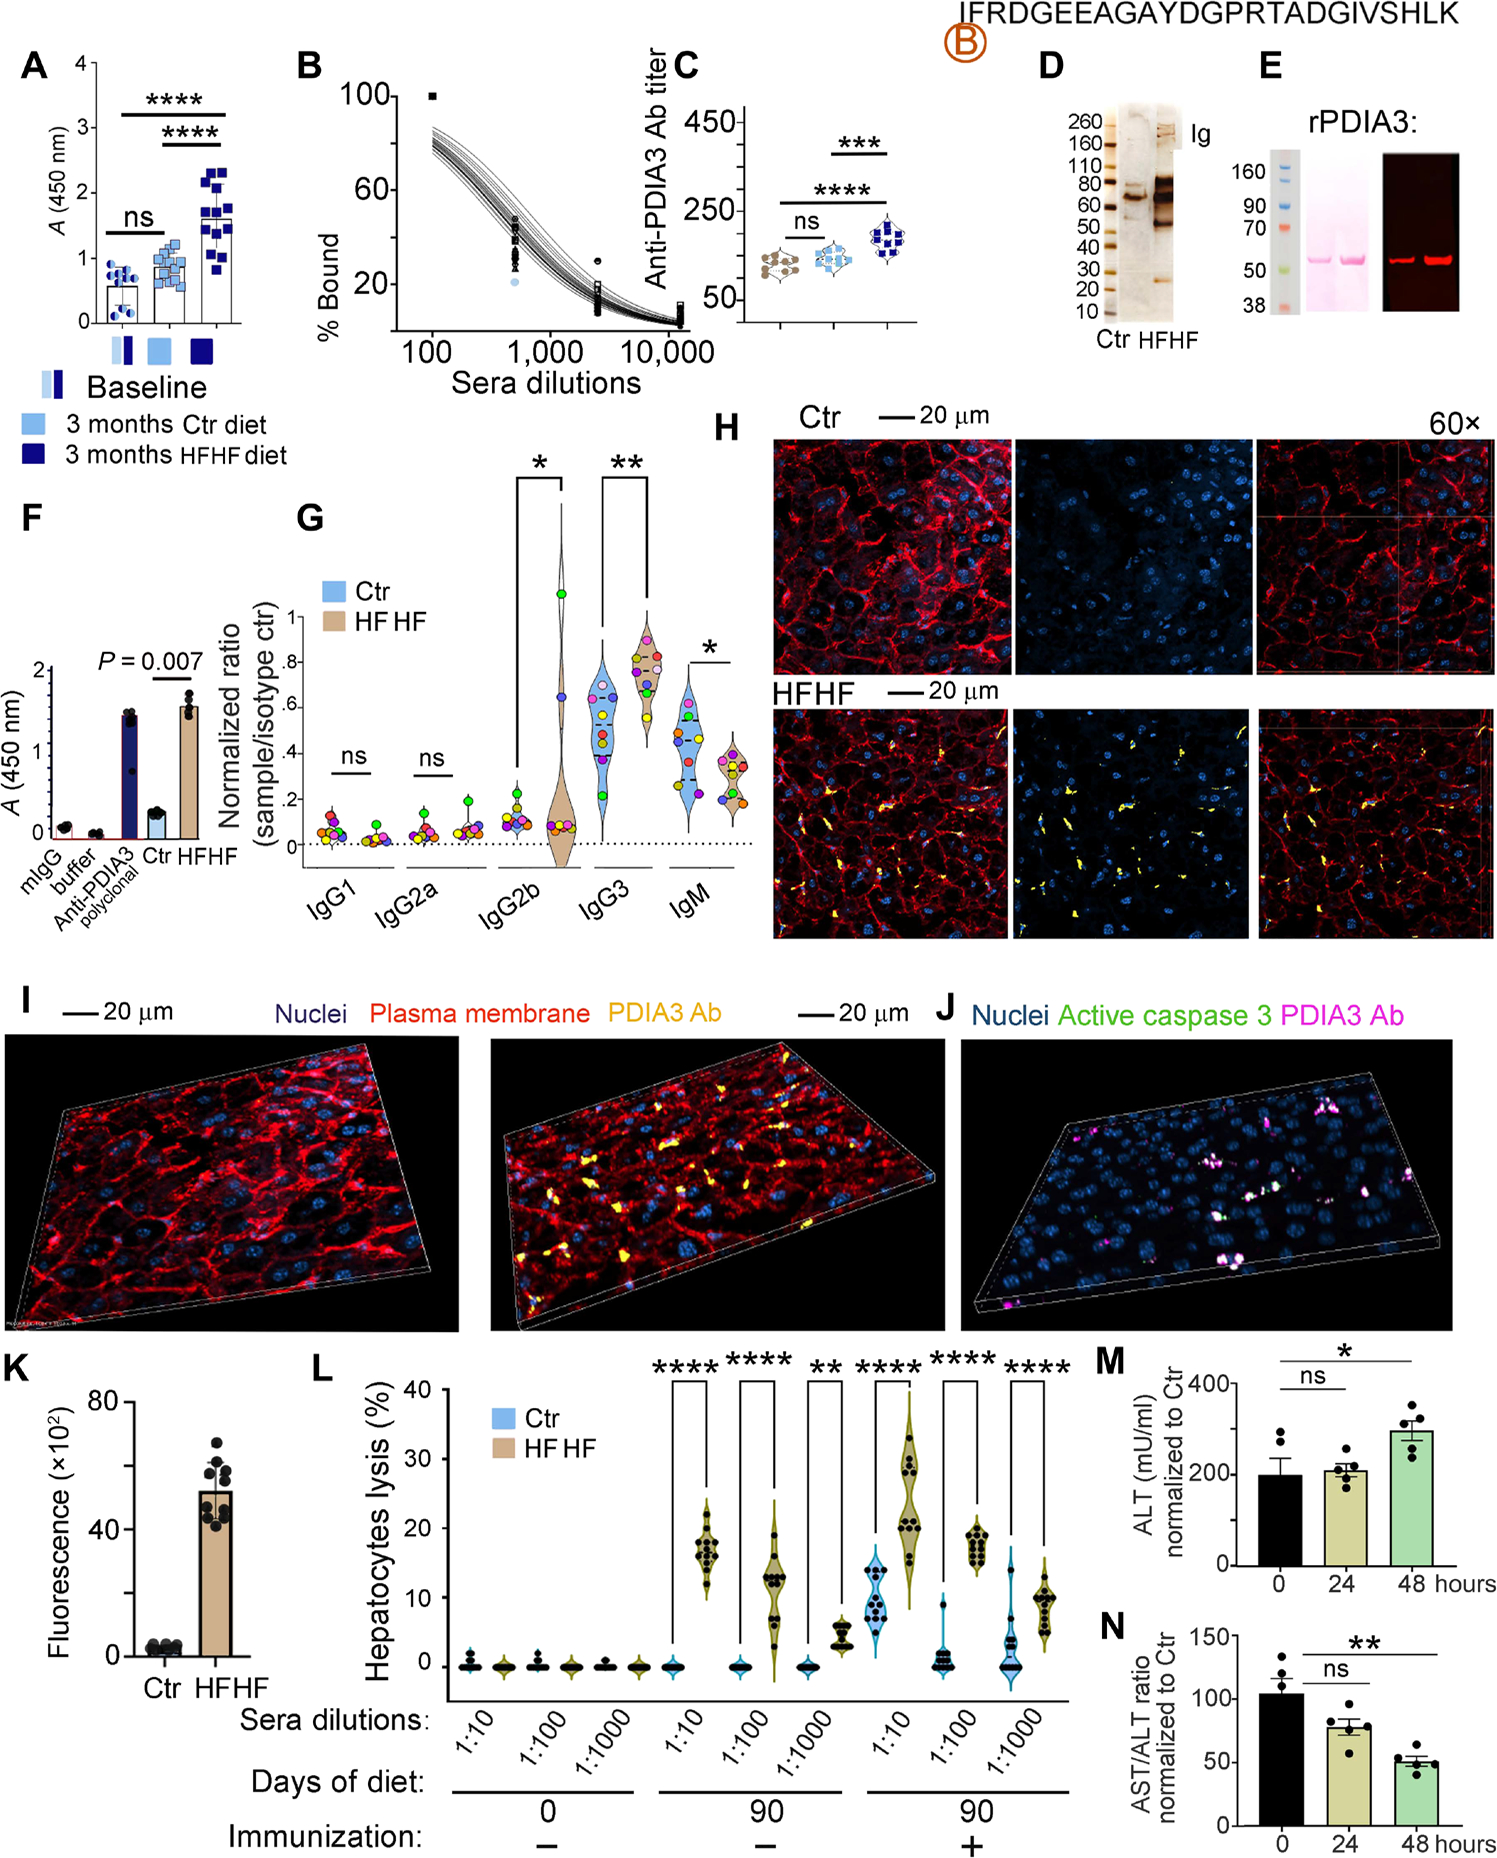
(A) ELISA quantification of antibody response to the PDIA3 peptide in mice at baseline or after 3 months following control or HFHF diet. Values, from n = 10 to n = 13 biologically independent replicates, are reported as mean relative expression ± SD and were statistically analyzed using a one-way ANOVA (α = 0.05) followed by Tukey’s multiple comparison test. Significance levels are reported as ****P < 0.0001. (B) Example of sera titration from one of the samples in (A), diluted 100-, 1000-, and 10,000-fold. (C) PDIA3 titer is reported for n = 9 biologically independent replicates. Data are reported as mean relative expression ± SD and were statistically analyzed using one-way ANOVA (α = 0.05) followed by Tukey’s multiple comparison test. Significance levels are reported as ****P < 0.0001 and ***P < 0.001. Significance levels are reported as **P < 0.01 and ***P < 0.001. (D) Sera from control and HFHF mice were purified on biotin-labeled PDIA3 peptide affinity columns, and the eluate was run on SDS-PAGE gel followed by silver staining. (E) Eluted antibodies were validated by immunoblotting using human recombinant His-tag PDIA3; representative immunoblotting (right) probed with HFHF-eluted antibodies shows the expected 58.5 to 60.0 kDa corresponding to the His-tag PDIA3 loaded at 2 and 5 μg, respectively, on an SDS-PAGE gel; left, Ponceau S staining after transfer. (F) Eluted antibodies were also validated by ELISA against the full-length PDIA3 protein. Values, from n = 4 biologically independent replicates, are reported as mean relative expression ± SD and were statistically analyzed using one-way ANOVA (α = 0.05) followed by Tukey’s multiple comparison test. Significance levels are reported as ****P < 0.0001 for the antibodies purified from sera of control and HFHF mice. (G) Isotype testing was performed on the PDIA3-purified antibody from sera of mice at baseline and after HFHF diet. Data are reported as normalization to the A450 nm reading for each specific isotype control. Mice are color-coded to visualize isotype amount in each mouse. Each dot represents the average of technical quadruplicates, and data are reported for n = 8 biological replicates with significance levels *P < 0.05 and **P < 0.01 (two-way ANOVA and multiple comparisons using Fisher’s LSD test). Applying the unpaired t test retrieved significant difference between the relative abundance of IgM fraction in the sera from control versus HFHF mice (P < 0.05). (H) Representative confocal images of infiltrating PDIA3-specific antibody (Cy5-tagged; yellow) in the liver of control and HFHF mice. Plasma membrane is stained with wheat germ agglutinin–Alexa Fluor 594 (red) and nuclei with DAPI (blue). Confocal images were collected in Z-stack of 5-mm thickness. (I) Representative three-dimensional (3D) view of confocal images of control and HFHF mouse liver collected as in (H). (J) Representative 3D confocal images of infiltrating PDIA3-specific antibody (Cy5-tagged; magenta) in the liver of control and HFHF mice binding to hepatocytes positive for active caspase 3 (green). Confocal images were collected in Z-stack of 5-mm thickness. (K) Fluorescence quantification for the PDIA3-specific antibody (Cy5-tagged; magenta) in the liver of control and HFHF mice after intravenous injection 24 hours before (n = 10 biological replicates). (L) Twenty thousand calcein-labeled liver cells (prepared from control or HFHF mice) were incubated with titrated amounts of the PDIA3 peptide–purified antibodies [as prepared in (C)] and incubated with 1 × 10⁵ nodal cells, also harvested from control and HFHF mice. After 6 hours, cultured cells were washed to eliminate dead cells and the remaining calcein-labeled cells were quantified by fluorescence (490-nm excitation and 520-nm emission filters). Data are reported as percentage of lysed cells. SDS-lysed cells were used as positive control (100% lysis), and untreated cells were used as negative control (no lysis). Values, from n = 10 to n = 14 biologically independent replicates, are reported as mean relative expression ± SD and were statistically analyzed using a two-tailed paired Student’s t test. Each dot symbol is an average of technical quadruplicates, and the data were statistically analyzed using one-way ANOVA and Tukey’s multiple comparisons test. Significance levels are reported as **P < 0.01 and ****P < 0.0001. (M) ALT quantification in control and HFHF sera before and after 24 and 48 hours from the injection of control and HFHF antibody (100 μg per mouse). Data are reported as mean concentration ± SD (normalized to control diet) and were statistically analyzed using a one-way ANOVA test followed by Dunnett’s multiple comparison test. Significance levels are reported as *P < 0.05. (N) Ratio between AST/ALT quantified in control and HFHF sera before and after 24 and 48 hours from the injection of control and HFHF purified antibody (100 μg per mouse). Data are reported as a ratio between the two enzymes, and values were normalized to control diet. Values of n = 5 biologically independent replicate is reported. Significance levels are reported as *P < 0.05.