
Fig. 6. High-fat and high-fructose diet induces T cell–mediated liver damage.
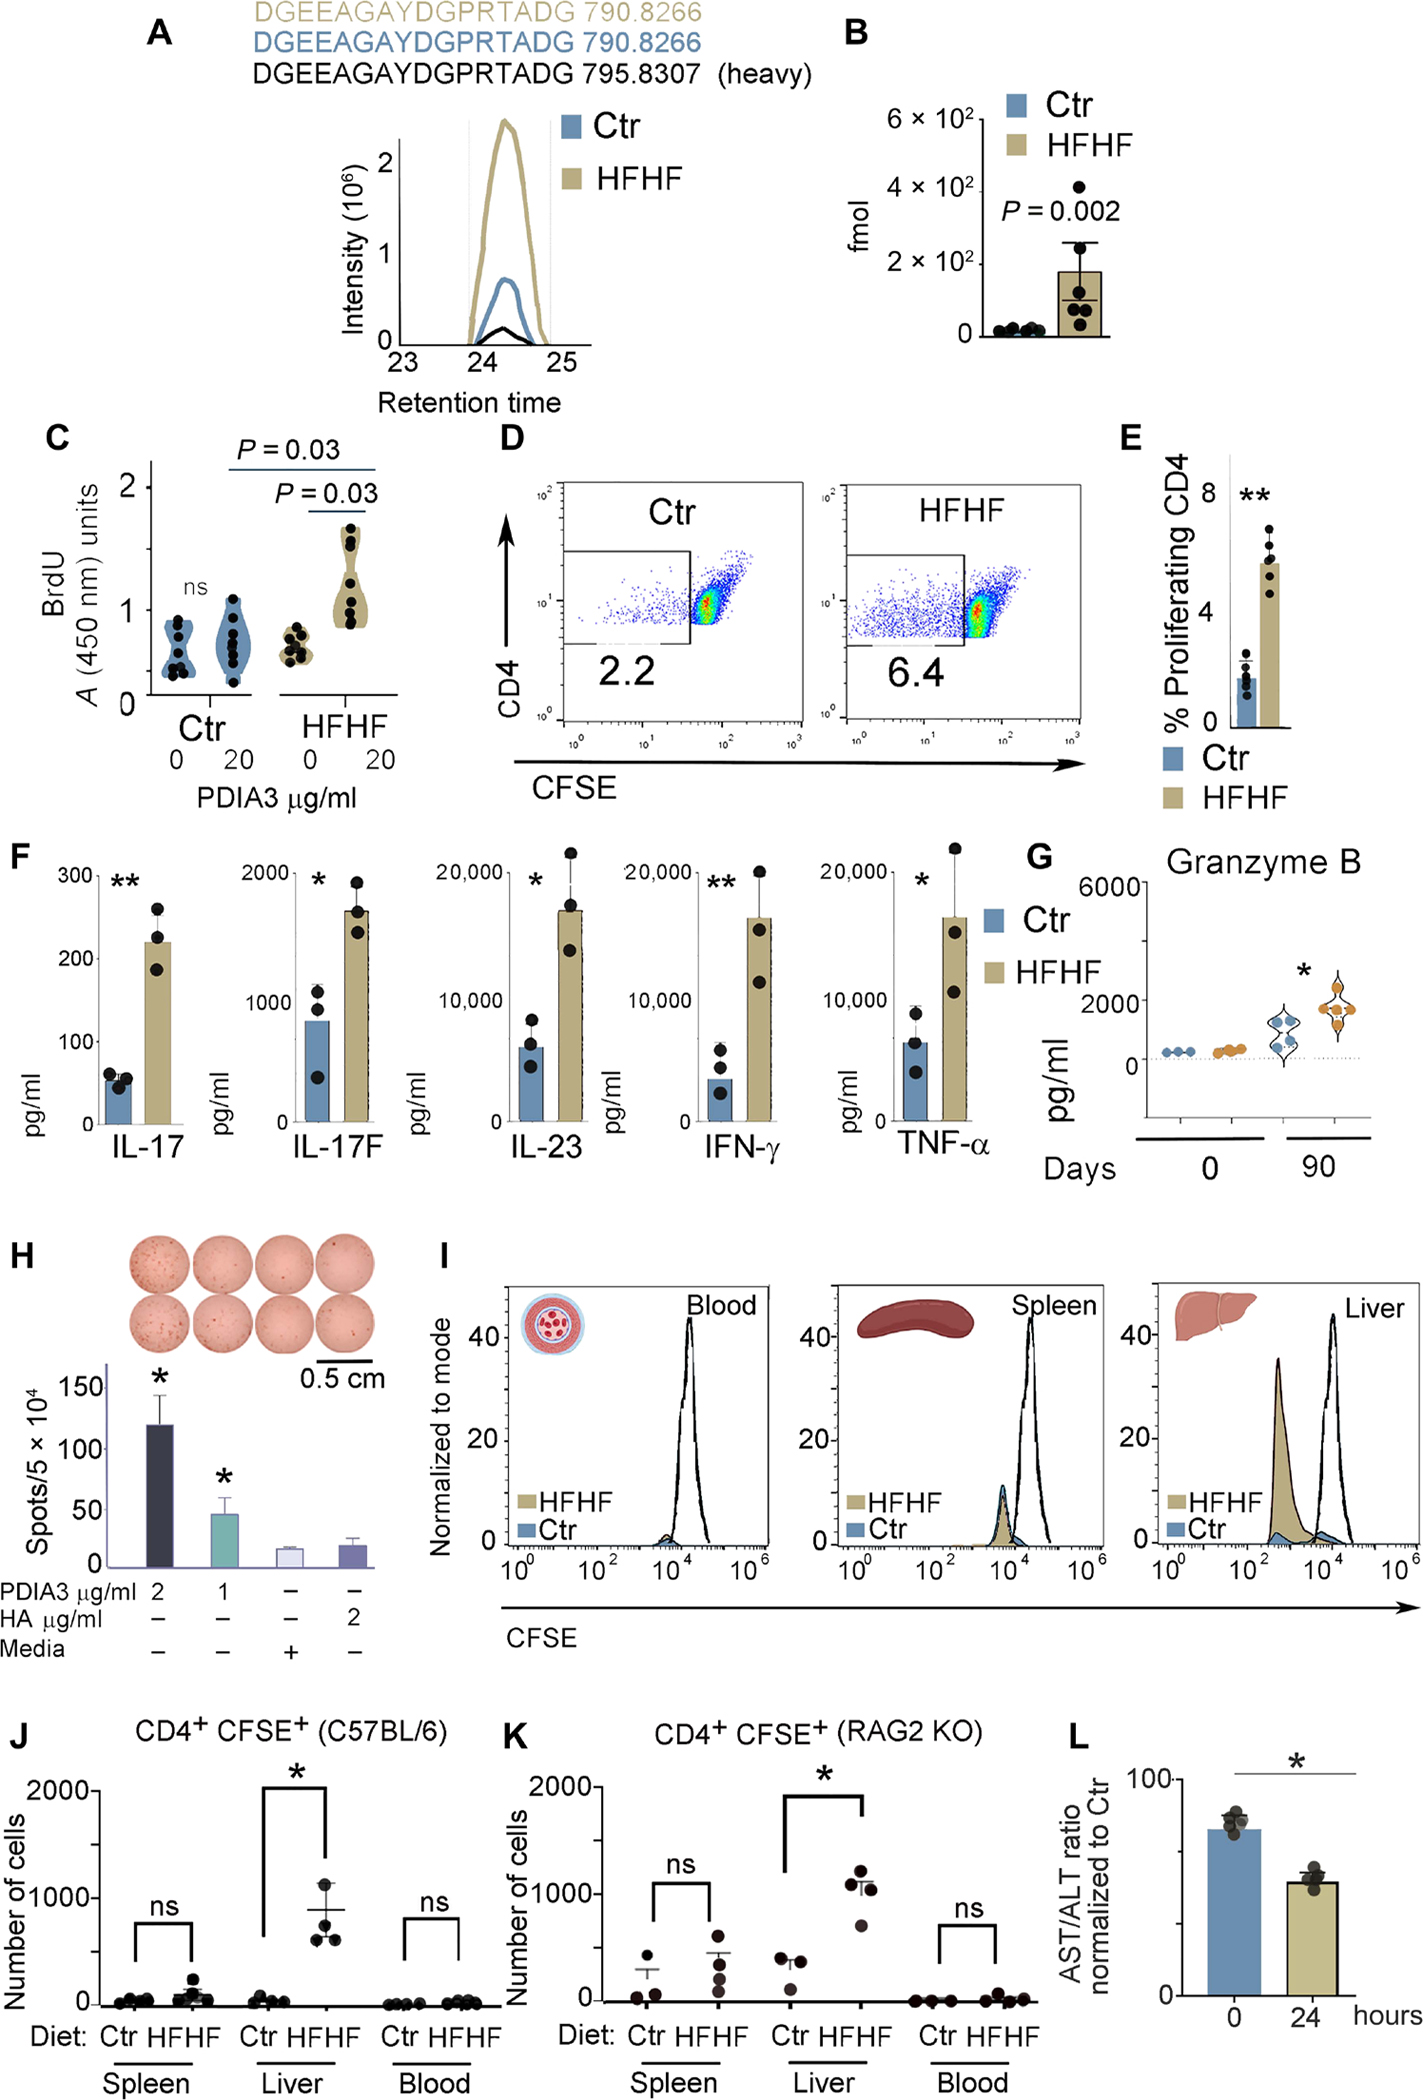
(A) MS-based PRM for absolute peptide quantitation and representative ion-extracted chromatogram of the MS1 precursors matching the 2 fmol of spiked heavy peptide DGEEAGAYDGPR[+10]TADG from PDIA3 (in black). The corresponding endogenous light peptides, found in the total peptidomes eluted from the liver immune infiltrates of control and HFHF mice, were coeluted with the spiked heavy standard. The complete transition list associated with the heavy and light (endogenous) peptide is presented in table S3. (B) PRM-derived quantitative analysis of endogenous DGEEAGAYDGPRTADG in the total peptidomes from the liver immune infiltrates of control and HFHF mice. Values, from n = 6 biologically independent replicates, are reported as mean relative expression ± SD and were statistically analyzed using an unpaired Mann-Whitney t test. Significance levels are reported as **P < 0.01. (C) Liver-infiltrating immune cells were cultured in the absence or presence of the PDIA3 peptide (20 μg/ml), and proliferating cells were quantified by 5-bromo-2′-deoxyuridine (BrdU) incorporation. Values, from n = 8 biologically independent replicates, are reported as mean relative expression ± SD and were statistically analyzed using multiple paired Student’s t test and Holm-Šídák method. Applying the unpaired t test retrieved a significant difference (P < 0.05) between the index proliferation of cells from control versus HFHF mice treated with PDIA3 peptide (20 μg/ml). (D and E) Immune infiltrates, separated as in (A), were labeled with CFSE and cultured with the PDIA3 peptide (20 μg/ml) for 3 days. Cells were then stained with CD4, and CFSElowCD4+ cells were quantified. Values, from n = 6 biologically independent replicates, are reported as mean relative expression ± SD and were statistically analyzed using a two-tailed unpaired Student’s t test. Significance levels are reported as **P < 0.01. (F) Total liver cell lysates harvested from control and HFHF mice were analyzed for inflammatory cytokines using the TH17 arrays as described in Materials and Methods. Values, from n = 3 biologically independent replicates, are reported as mean relative expression ± SD and were statistically analyzed using a two-tailed unpaired Student’s t test. Significance levels are reported as *P < 0.05 and **P < 0.01. (G) GZMB quantification by ELISA in liver immune infiltrates of control and HFHF mice prepared as in (E). Values, from n = 3 to n = 4 biologically independent replicates, are reported as mean relative expression ± SD and were statistically analyzed using ANOVA and Tukey’s multiple comparison test. Significance levels are reported as *P < 0.05 and **P < 0.01. (H) ELISPOT assay was performed on a PDIA3-specific T cell line prepared from lymph nodes isolated from HFHF-immunized mice. A statistically significant difference was observed for PDIA3 peptide (1 and 2 μg/ml) as compared with nonspecific hemagglutinin (HA) peptide and media alone. (I) Control and HFHF mice were injected with a CFSE-labeled PDIA3 T cell line; blood, spleen, and liver were harvested 24 hours after injection, and CD4+-CFSE+ cells were quantified. Representative histograms for control and HFHF mice. (J and K) Number of CD4+ CFSE+ cells harvested in each indicated organ from control and HFHF-injected mice. Experiments were performed in both C57BL/6 (K) and RAG2KO (L) mice kept for 3 months on a control or HFHF diet. Values from n = 3 or 4 biologically independent replicates are reported. Data were statistically analyzed by using two-tailed unpaired student’s t test. (L) AST/ALT ratio calculated from the sera of HFHF mice after injection of the PDIA3 T cell line. Data are normalized to control mice also injected with the PDIA3 T cell line. Values of n = 4 biologically independent replicates are reported. Data were statistically analyzed using one-way ANOVA followed by Dunnett’s multiple comparison test. Significance levels are reported as *P < 0.05.