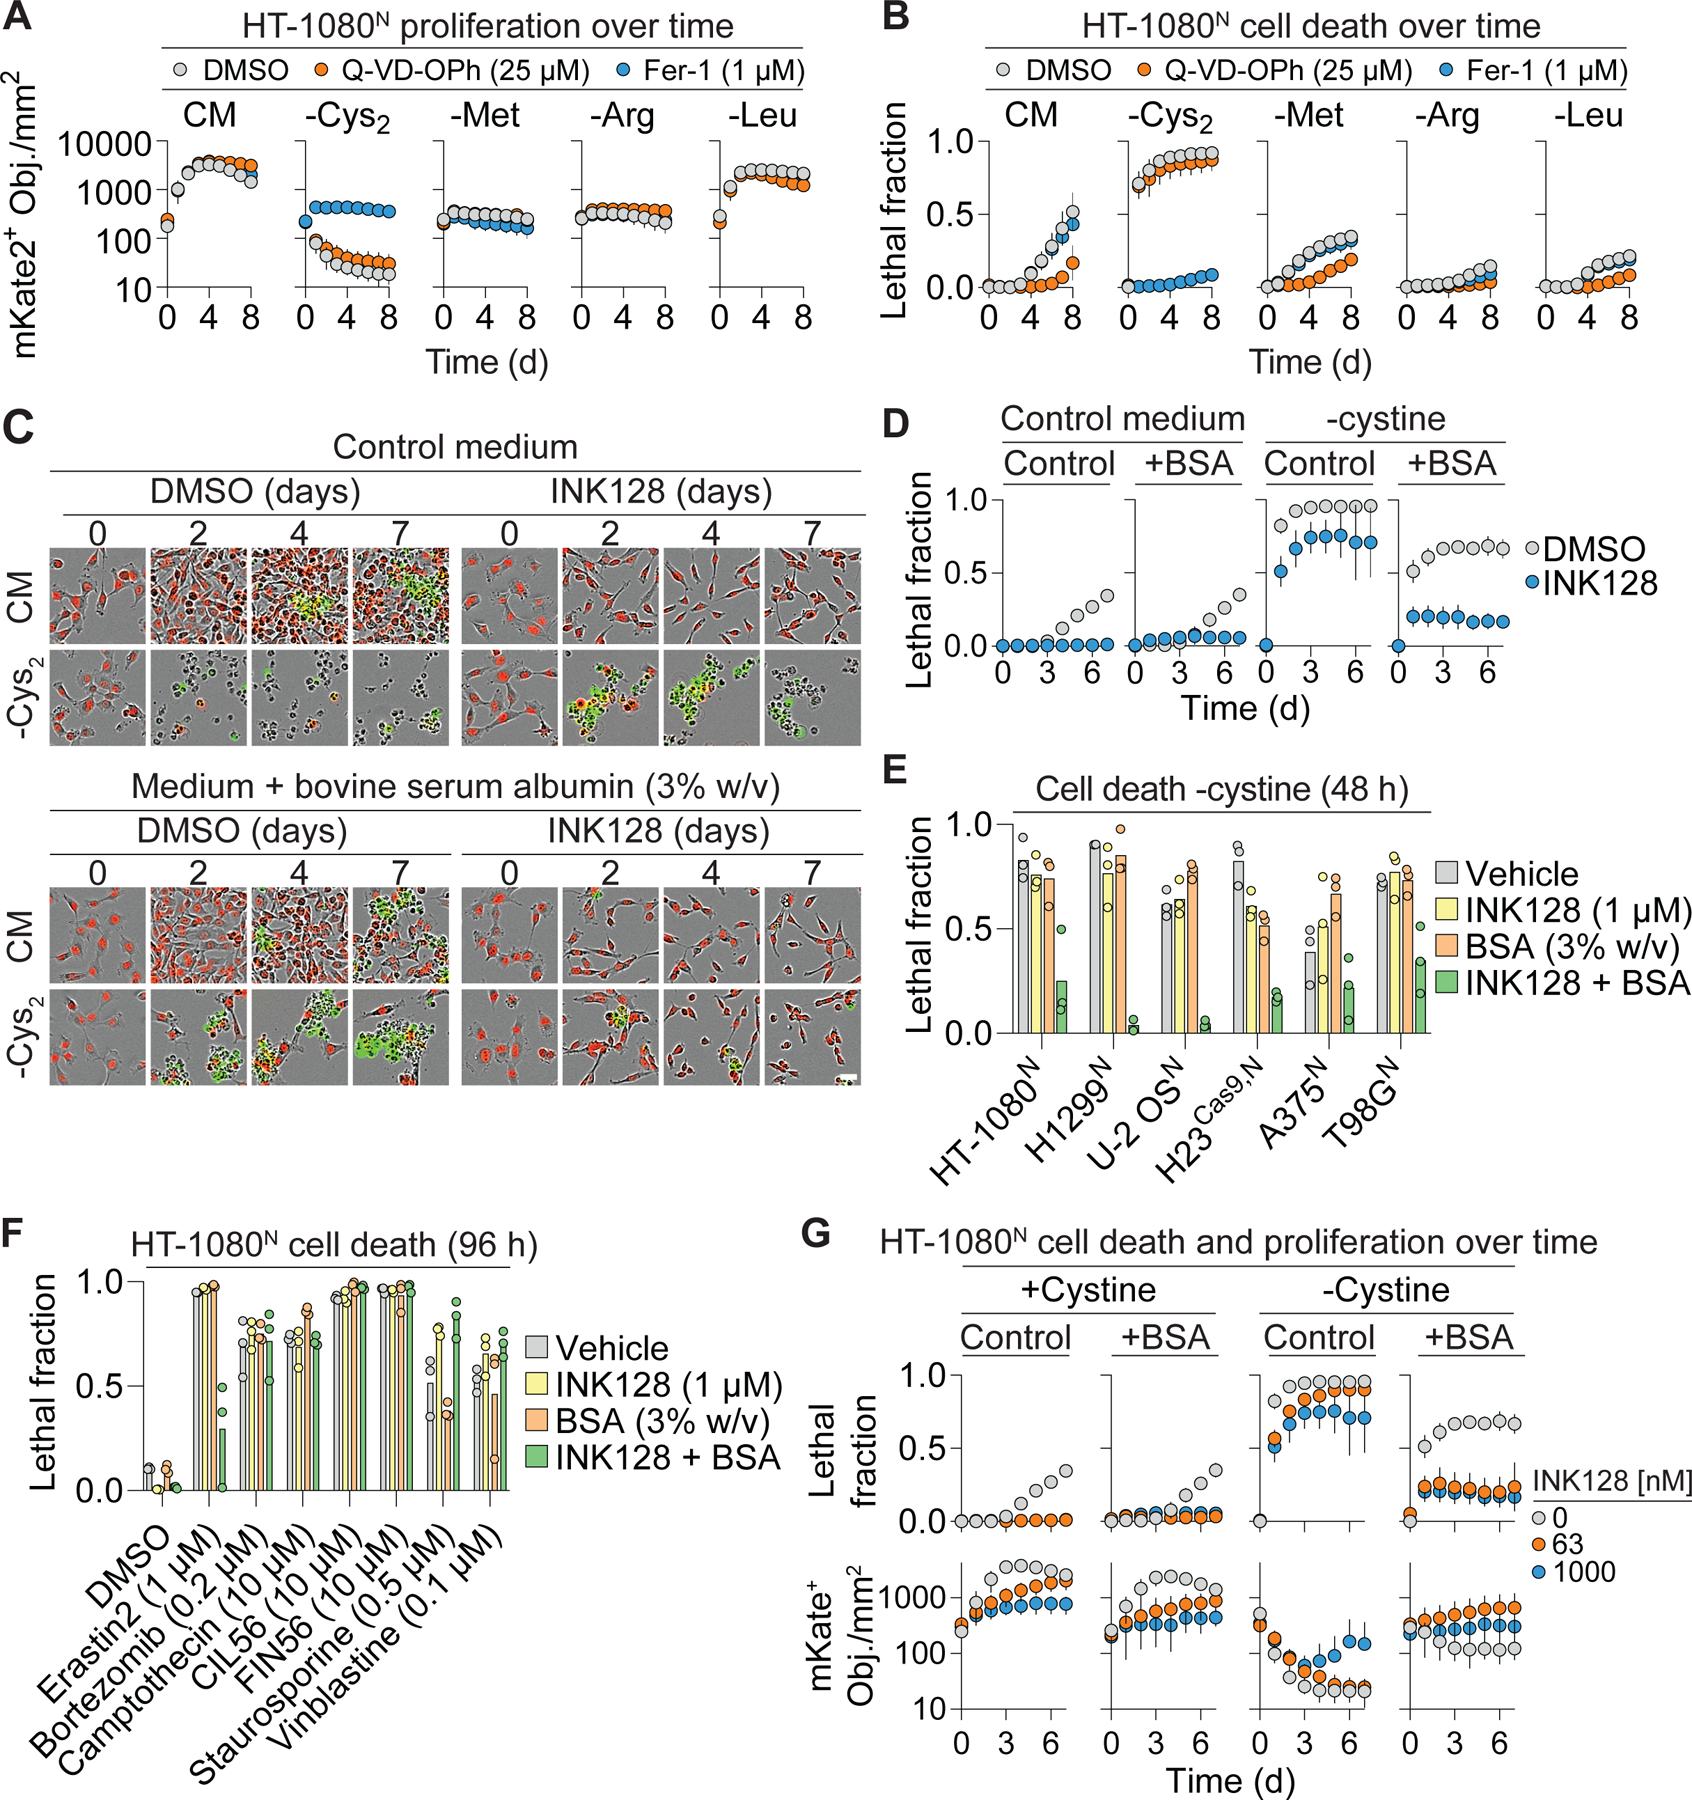
Figure 1. Albumin promotes cell survival in response to cystine deprivation.

(A) Cell proliferation determined by live cell (nuclear-mKate2 positive objects; mKate2+ Obj.) counts over time in complete medium (CM) or medium lacking the indicated amino acid ± apoptosis (Q-VD-OPh) or ferroptosis (Fer-1) inhibitors. Cys2: cystine. (B) Cell death in populations from (A) determined by integration of live (mKate2+) and dead (SYTOX Green-positive) counts over time into the lethal fraction score (Forcina et al., 2017). A lethal fraction score of 0 equals no cell death and 1 equals complete population cell death. (C) Representative images from three independent experiments of HT-1080N cells cultured over time in complete medium (CM) or medium lacking cystine. Medium contains 20 nM SYTOX Green to mark dead cells. INK128: 1 µM. Scale bar = 30 µm. (D) Quantification of cell death in (C). BSA: bovine serum albumin. (E) Cell death in different cell lines in medium lacking cystine. (F) Cell death in response to different inducers of cell death. (G) Cell death and proliferation over time. Note that some of the lethal fraction data shown here for comparison purposes is also depicted in (D). These data were from the same experiment. Results in (A, B, D, and G) are mean ± SD from three independent experiments. Datapoints from independent experiments are shown in (E) and (F). See also Figure S1 and Figure S2.
