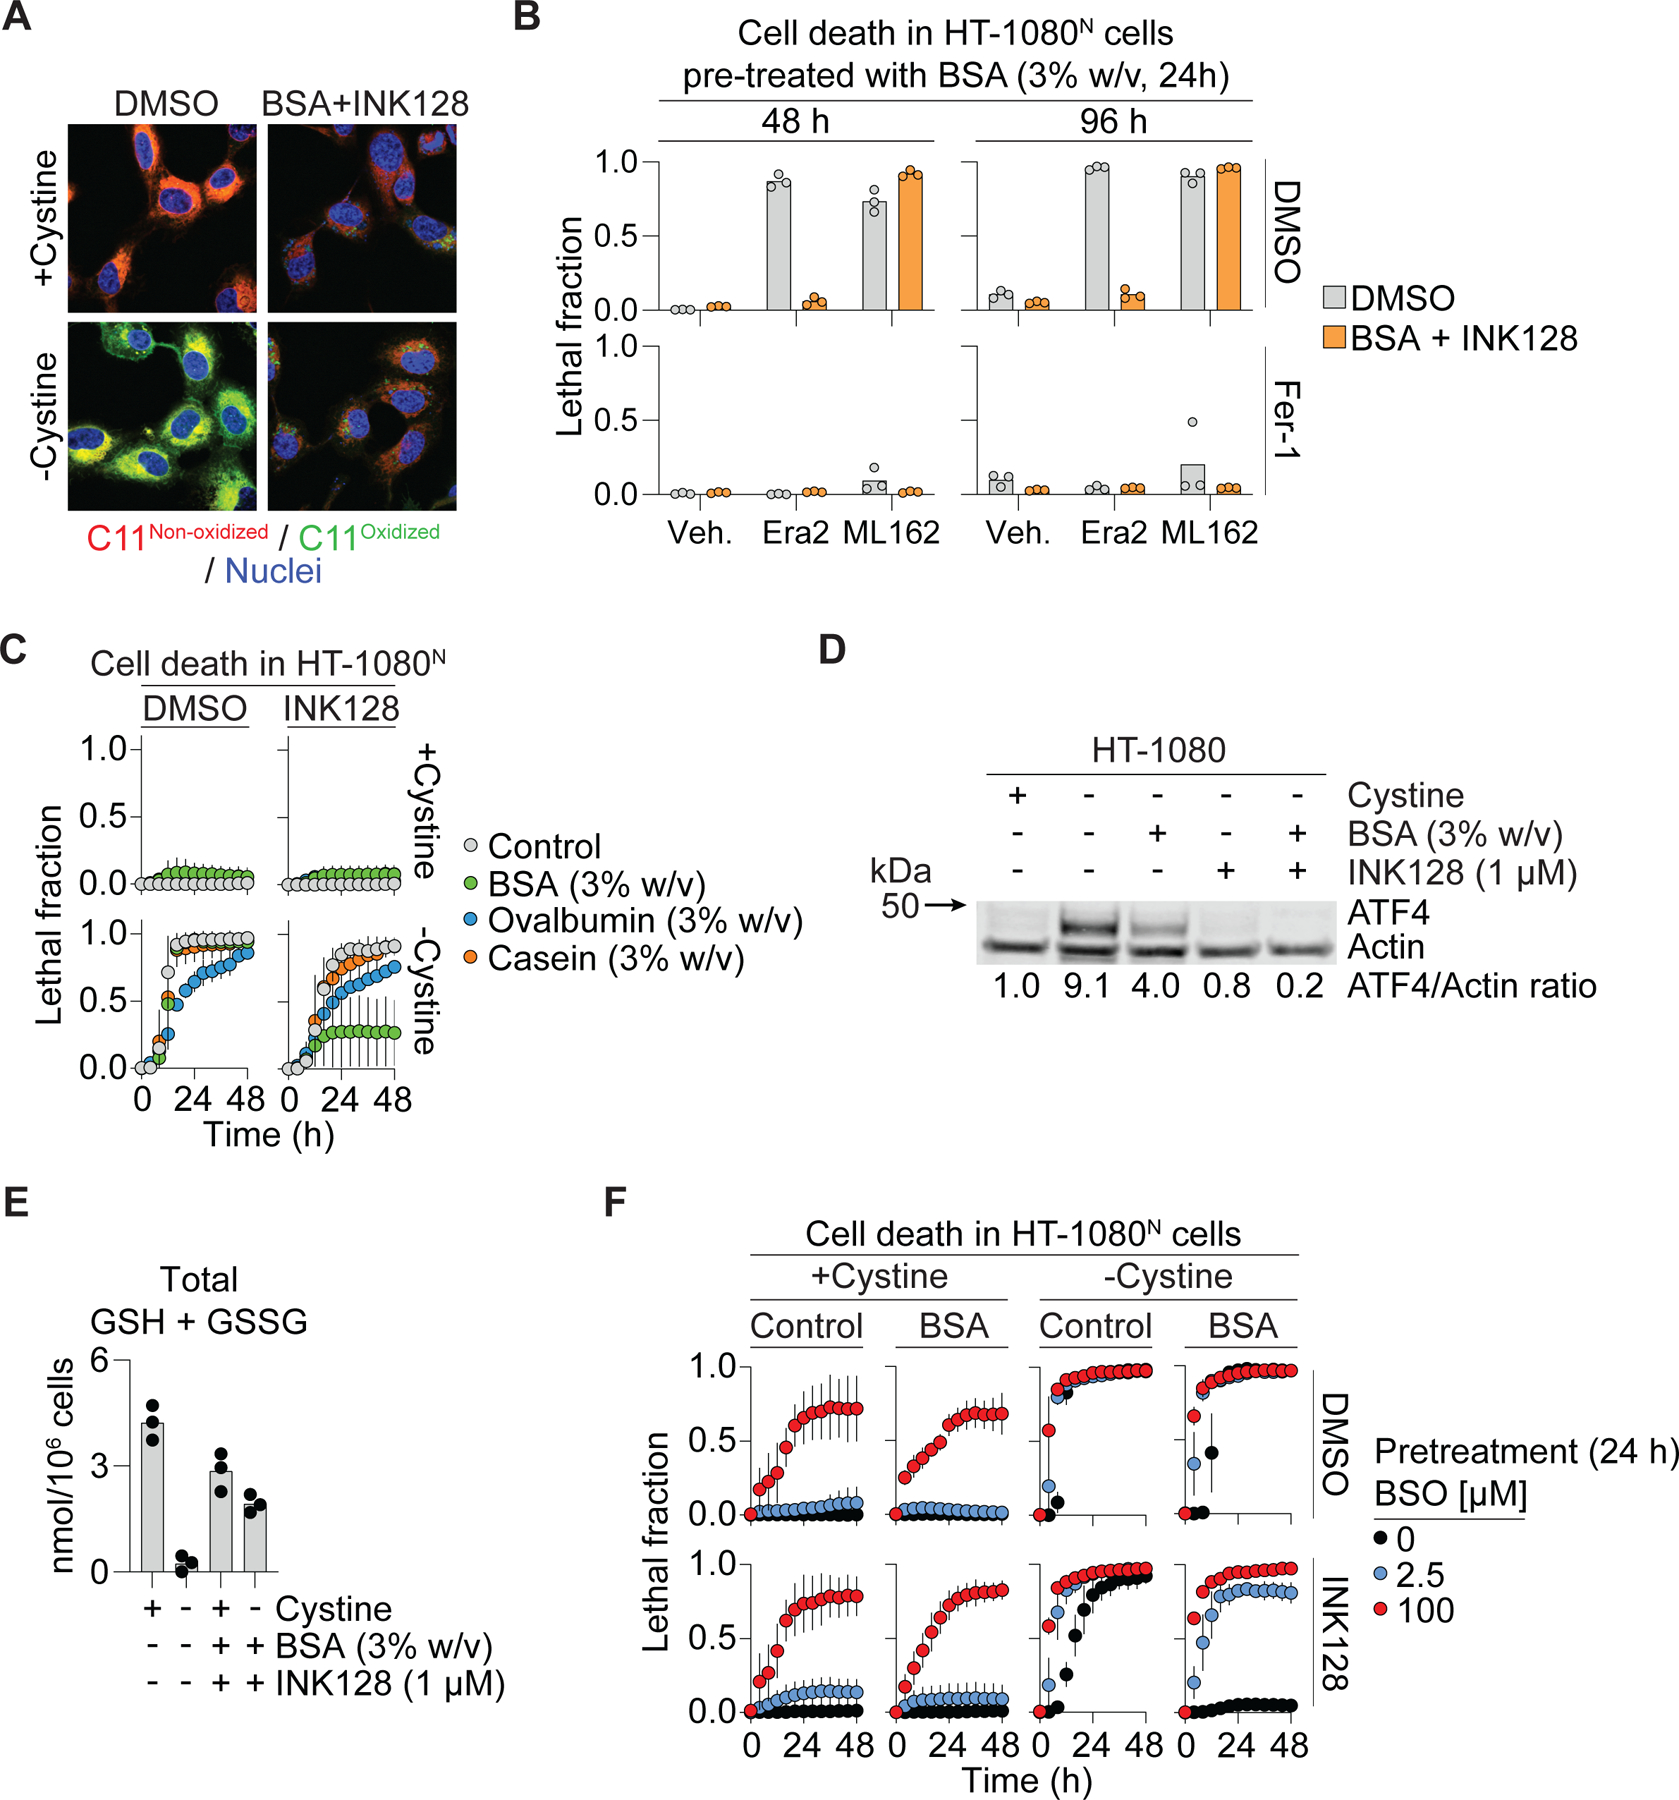
Figure 2. Albumin increases glutathione levels during cysteine deprivation.

(A) C11 BODIPY 581/591 (C11) oxidation assessed by confocal microscopy in HT-1080 cells. BSA: bovine serum albumin (3% w/v). INK128: 1 µM. Scale bar = 20 µm. (B) Cell death in HT-1080N cells pre-treated with BSA (24 h) then treated as indicated at time 0 and examined 48 and 96 h later. Era2 (erastin2): 1 µM. ML162: 2 µM. Fer-1 (ferrostatin-1): 1 µM. (C) Cell death over time. INK128: 1 µM. (D) Protein levels following 10 h treatment. Blot is representative of three independent experiments. Mean ATF4/Actin protein level ratios (normalized to the +cystine condition) determined from densitometry of three independent blots are indicated. (E) Total glutathione (GSH + GSSG) following 8 h treatment. INK128: 1 µM. (F) Cell death following 24 h pretreatment ± BSO (buthionine sulfoximine) then treated as indicated alongside BSO. BSA: 3% w/v. Results in (B) and (E) show datapoints from independent experiments. Results in (C) and (F) are mean ± SD from three independent experiments. See also Figure S3.
