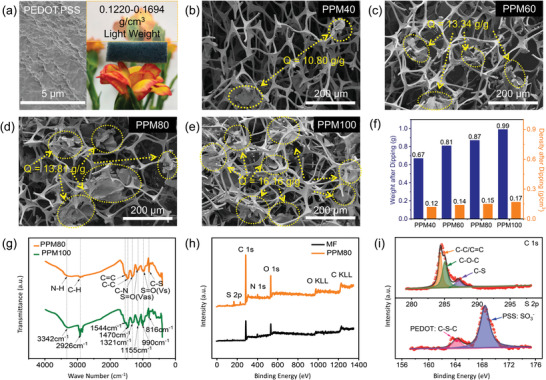
Figure 2.

a) SEM image of the pure PEDOT:PSS sample with digital photograph of PPM sample placed on top of an orange flower. b–e) SEM images of PPM40, PPM60, PPM80, and PPM100 foams, respectively. f) Mass and density diagram of the 3D hybrid foams. g) FT‐IR spectra of PPM samples. h) XPS survey scan of pristine melamine sponge and PPM80 specimen. i) High‐resolution of C 1s and S 2p of the as‐prepared PPM80 sample.
