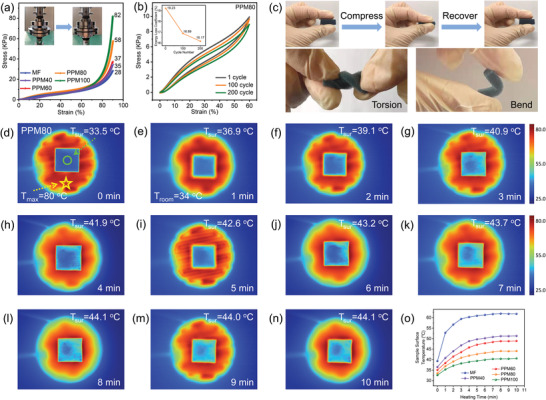
Figure 3.

a) Compressive stress–strain (σ–ε) curves of PPM foams at 90% strain. b) Fatigue test of PPM80 at 60% strain for 200 cycles. Inset: energy loss coefficients over 200 cycles. c) A series of digital images showing compress–recover process and remarkable deformation feature of torsion and bend of the 3D hybrid foams. d–n) Thermal infrared images of PPM80 sample captured at intervals of 1 min from 0 to 10 minutes. o) Variation tendency of the temperature detected on the upper surface of samples versus different heating time at a fixed set temperature of heating platform.
