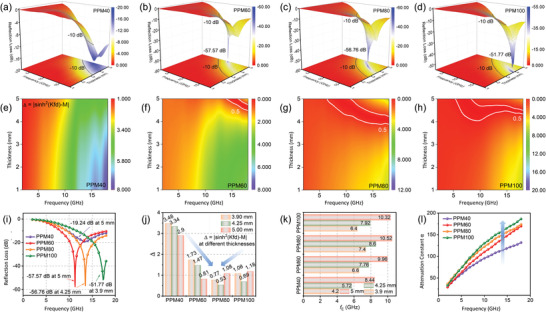
Figure 4.

a–d) 3D RL plots of PPM40, PPM60, PPM80, and PPM100/paraffin composites, respectively. e–h) The calculated delta values versus frequency maps (1–5 mm) of a set of PPM/paraffin samples. i) Reflection loss intuitive comparison curves of the 3D hybrid foams. j) Average delta values and k) effective bandwidth comparison column charts of the 3D hybrid foams at the thickness of 3.9, 4.25, and 5 mm. l) Attenuation constant evaluation plots in the frequency range 2–18 GHz.
