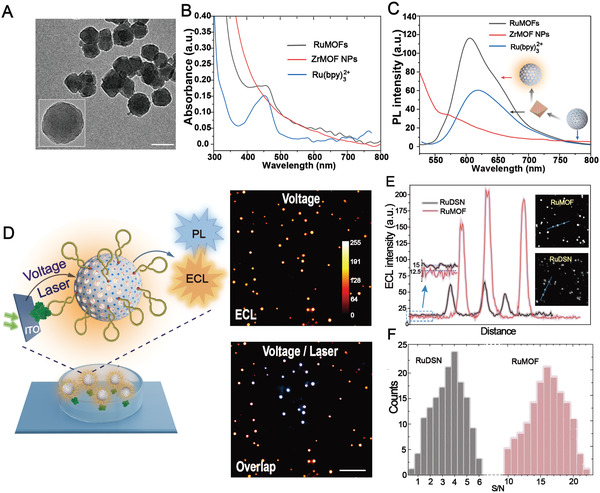
Figure 1.

ECL performance characterization of RuMOFs nanoemitter. A) TEM image of RuMOFs and ZrMOF NPs (inset). Scale bar, 100 nm. B,C) UV–vis absorption spectra and photoluminescence spectra of RuMOFs, ZrMOF NPs, and Ru(bpy)3 2+, respectively. D) Single‐molecule ECL and PL images of nanoemitters recorded with a voltage or laser. Exposure time is 1 s. Scale bars (white), 3 µm. E) ECL spatial‐intensity profiles of individual RuMOFs and RuDSN along blue line in ECL images (insets on the right). The background intensities are shown in the inset (left). F) ECL signal‐to‐noise (S/N) distribution of RuMOFs and RuDSN, respectively. The S/N of the RuDSN and RuMOF were integrated in units of 0.5 and 1, respectively. At least 150 nanoemitters were analyzed.
