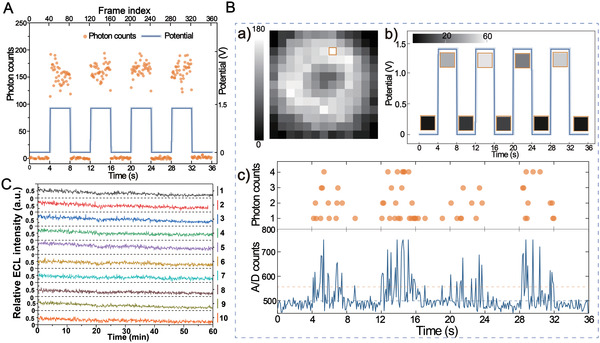
Figure 2.

ECL visual details of nanoemitters at single‐molecule level. A) Synchronization signals for voltage and per frame photon counts of individual RuMOF emitter. B) the photon counting image of individual emitter from 360 frames a), and synchronization signals for voltage and 40 frame photon counting images b), and for per frame photon counts and the analogue‐to‐digital (A/D) counts c) of the single image pixel marked in a), the light blue dashed indicates the threshold to identify single photon and the yellow dashed indicates single‐photon intensity. Exposure time is 0.1 s and electron‐multiplying gain is 300 for the synchronization signals. C) Corresponding ECL trajectory of the same set of 10 ECL nanoemitters marked in the (Figure S10A, Supporting Information).
