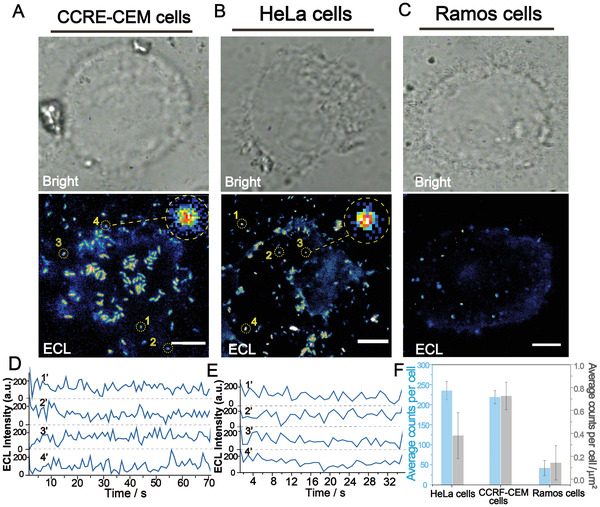
Figure 4.

The verification of the accuracy and effectiveness of ECL nanoemitters approach monitoring single proteins on living cells. A) Bright‐field and ECL image of CCRF‐CEM cells. Scale bars, 3.5 µm. B) Bright‐field and ECL image of HeLa cells. Scale bars, 6 µm. C) Bright‐field and ECL images of Ramos cells. Scale bars, 5 µm. D) ECL trajectories of single‐molecule ECL signal spots marked in ECL image of A). E) ECL trajectories of single‐molecule ECL signal spots marked in ECL image of B). F) The average number of ECL spots on single cell (blue) and per square micrometer in per cell (gray) including HeLa cells, CCRE‐CEM cells and Ramos cells. The error bars were obtained by analysis of 20 cells.
