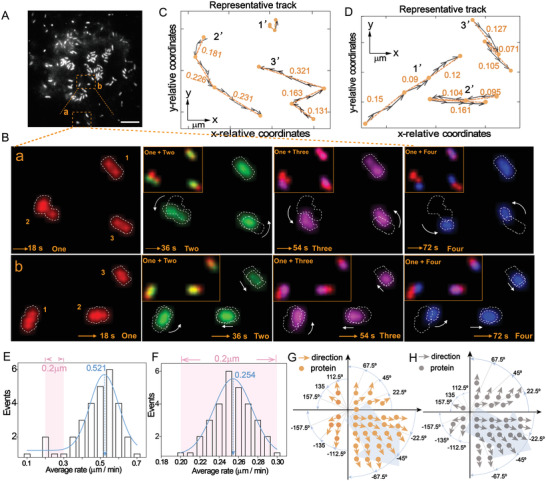
Figure 5.

Real‐time ECL dynamic monitoring of membrane proteins. A) ECL image of single living cell for 72 frames. Scale bars is 3.5 µm. B) Dynamic monitoring of PTK7 proteins at different moments (18, 36, 48, and 72 s) for the selected a and b regions in A), the illustration shows an overlay of the current moment and the 18 s, and on the far right shows an overlay of the imaging at the four times and magnified images of representative movement proteins. C,D) Movement direction and relative position of protein from A) at different times in region a and b, respectively. E,F) Statistical analysis of the protein velocity of cellular peripheral region and medial region on single cell, respectively. The velocities were integrated in units of 0.05 and 0.01, respectively. G,H) Statistical analysis of the protein movement direction of cellular peripheral region and medial region on single cell, respectively. The data were analyzed with Image J and MATLAB.
