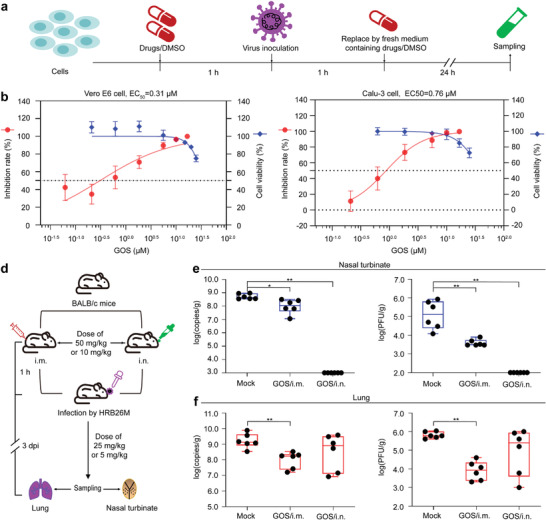
Figure 2.

Cellular and animal infection models testing the anti‐SARS‐CoV‐2 effects of GOS. a) Experimental design for the cellular anti‐SARS‐CoV‐2 study. b,c) The inhibitory effects of GOS toward SARS‐CoV‐2 in Vero E6 cells (b) and Calu‐3 cells (c), and assessment of potential cytotoxicity. The X‐axis represents GOS working concentration. The left and right Y‐axes represent the inhibition rate and cell viability, respectively. Data are presented as mean ± s.d. (n = 3). d) Experimental design of anti‐SARS‐CoV‐2 study in a mice infection model. e,f) The viral RNA load (left figures in (e) and (f)) and infectious titers (right figures in (e) and (f)) in the nasal turbinates (e) and lungs (f) with high‐dose GOS. The viral RNA copies and infectious titers were detected by qPCR and viral titration. The i.m. represents for intramuscular treatment; i.n. represents for intranasal treatment. Data are presented as mean ± s.d. (n = 6). ** p < 0.01, * p < 0.05.
