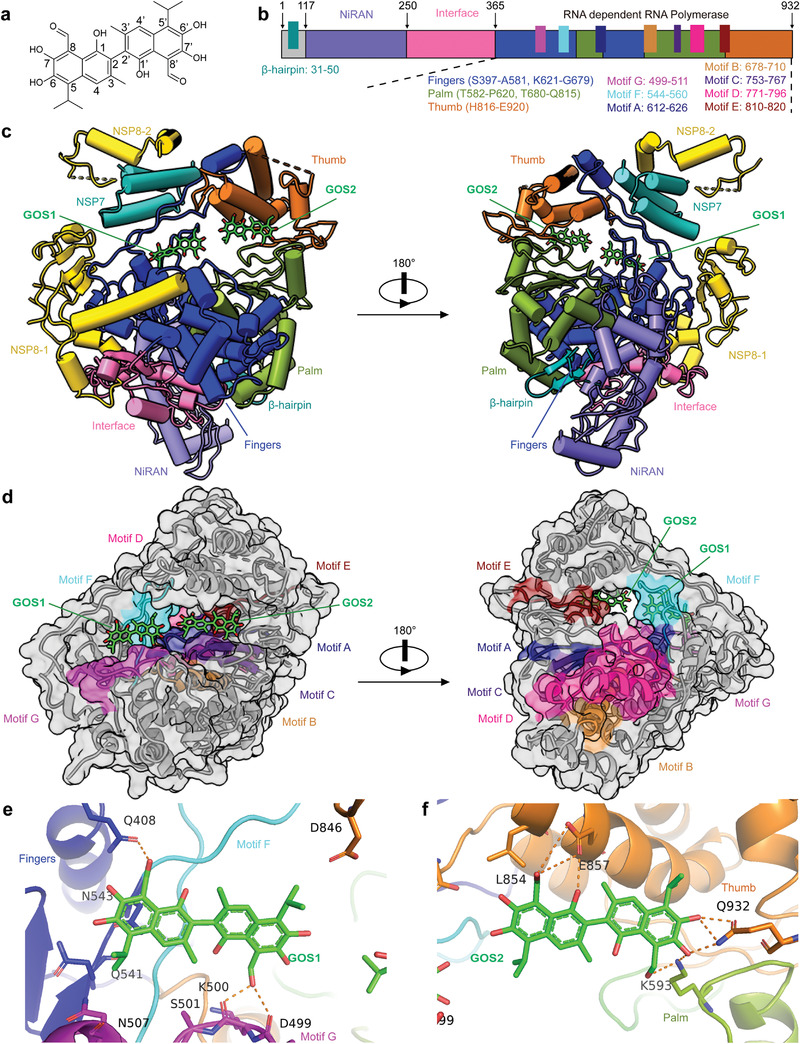
Figure 3.

Cryo‐EM structure of the GOS‐bound RdRp complex. a) The structure of GOS. b) Schematic diagram for the components of NSP12. c) Two structure views of NSP12‐NSP7‐NSP8 in complex with GOS. GOS is colored green. d) Two surface views of the RdRp motifs A–G with bound GOS1 and GOS2. e,f) Zoom in views of the interactions between the SARS‐CoV‐2 RdRp and GOS molecules. The hydrogen bond is displayed as a blue dashed line.
