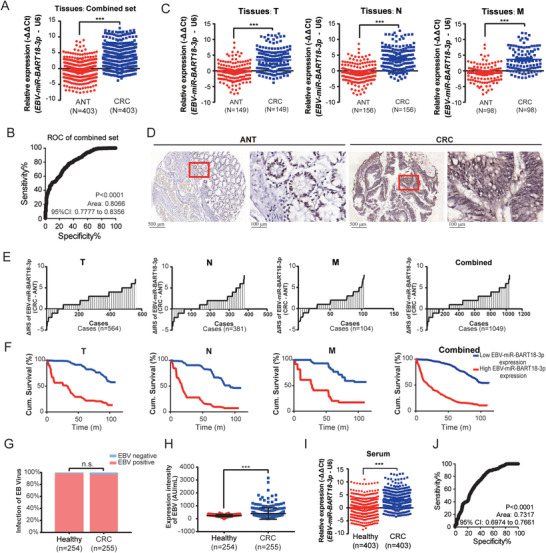
Figure 1.

EBV‐miR‐BART18‐3p expression is significantly associated with CRC progression. A) EBV‐miR‐BART18‐3p expression levels in fresh tissues from the combined set of patients for CRC (CRC) and adjacent noncancerous (ANT). Data are presented as −ΔΔCt (t‐test, three technical replicates each). B) Receiver operating (ROC) curve of EBV‐miR‐BART18‐3p to evaluate its ability to distinguish CRC and ANT tissues. C) The expression levels of EBV‐miR‐BART18‐3p in CRC or ANT tissues with T, N, or M stages (T: primary tumor; N: tumor with regional lymph node involvement; M: distant metastasis). Data are presented as −ΔΔCt (t‐test, three technical replicates each). D) Representative images of EBV‐miR‐BART18‐3p expression in tissue microarrays (TMAs). E) Immune reactive scores (IRS) for EBV‐miR‐BART18‐3p staining in TMAs. F) Kaplan–Meier curves showing the overall survival of CRC patients according to the tumoral EBV‐miR‐BART18‐3p expression levels in TMAs (log‐rank test). G) EBV prevalence rates of CRC patients and matched healthy donors (t‐test). H) EBV titers of CRC patients and matched healthy donors (t‐test). I) EBV‐miR‐BART18‐3p levels in the serum of CRC patients and matched healthy donors (t‐test, three technical replicates each). J) ROC curves to evaluate the diagnostic value of serum EBV‐miR‐BART18‐3p in CRC. **P < 0.01, ***P < 0.001.
