Figure 4.

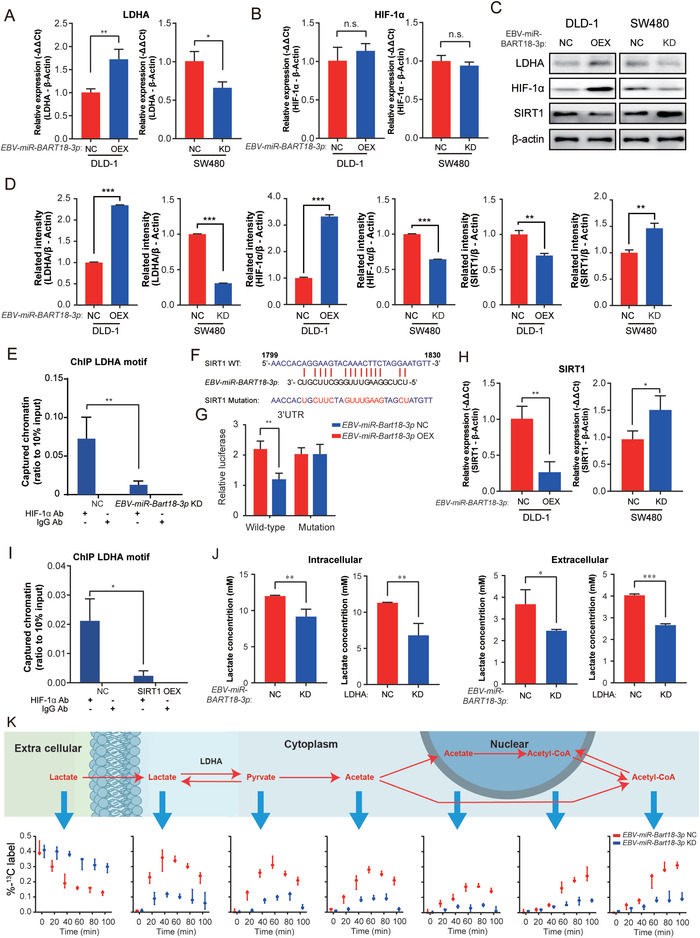
EBV‐miR‐BART18‐3p regulates metabolic pathways and acetyl‐CoA production by upregulating LDHA. A) LDHA and B) HIF‐1α mRNA expression levels in hypoxia‐treated CRC cells (EBV‐miR‐BART18‐3p NC vs KO; or EBV‐miR‐BART18‐3p NC vs OEX) as evaluated by PCR. Data are presented as −ΔΔCt (t‐test, n = 3/group). C) Western blot of LDHA, HIF‐1α, and SIRT1 protein levels in hypoxia‐treated CRC cells (EBV‐miR‐BART18‐3p NC vs KD; or EBV‐miR‐BART18‐3p NC vs OEX). D) Quantification of western blot results (t‐test, three technical replicates each). E) LDHA ChIP assays using HIF‐1α antibody in hypoxia‐treated SW480 cells (two‐way ANOVA, three technical replicates each). F) Predicted site for EBV‐miR‐BART18‐3p binding in the SIRT1 3’UTR; wild‐type (WT) and mutant sequences are indicated. G) Relative luciferase activities of hypoxia‐treated DLD‐1 cells expressing SIRT1 WT or mutant luciferase reporter plasmids and transfected with EBV‐miR‐BART18‐3p or NC mimics (t‐test, n = 3/group). (H) SIRT1 mRNA expression levels in hypoxia‐treated CRC cells (EBV‐miR‐BART18‐3p NC versus KD; or EBV‐miR‐BART18‐3p NC vs OEX) as evaluated by PCR. Data are presented as −ΔΔCt (t‐test, n = 3/group). I) LDHA ChIP assays using HIF‐1α antibody in hypoxia‐treated SW480 cells (two‐way ANOVA, three technical replicates each). J) The concentration of lactate in hypoxia‐treated SW480 cells and culture medium (t‐test, three technical replicates each). K) Schematic depicting the flux of 13C‐labeled lactate to acetyl‐CoA. The histograms show the flux of 13C in hypoxia‐treated EBV‐miR‐BART18‐3p NC and KD SW480 cells. n.s.: no significance, *P < 0.05, **P < 0.01, ***P < 0.001.
