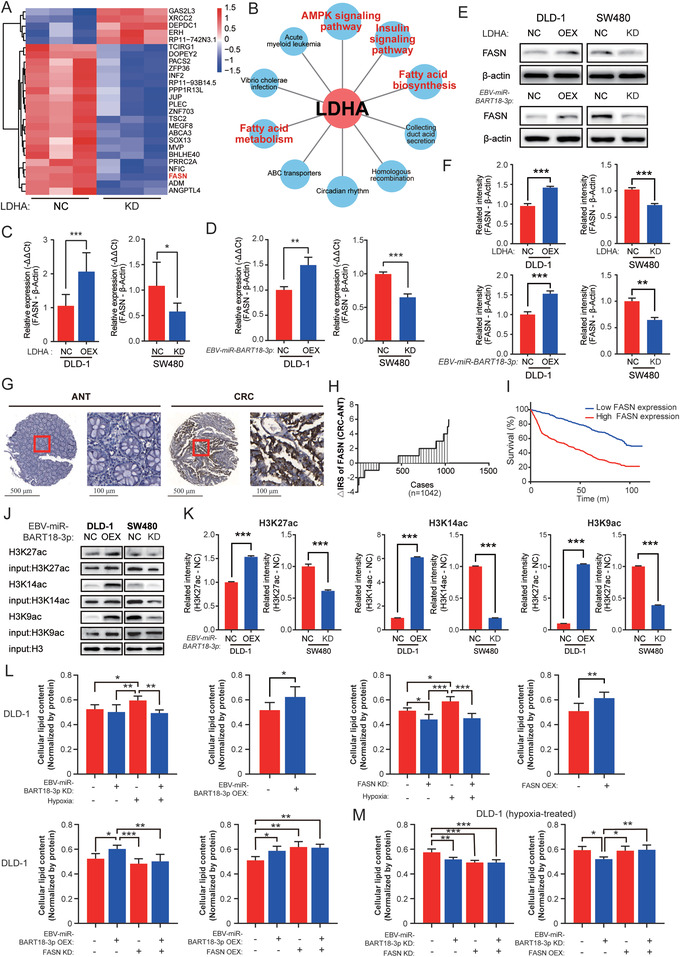
Figure 5.

EBV‐miR‐BART18‐3p promotes histone acetylation and enhances de novo lipogenesis. A) Heatmap showing differentially expressed mRNAs in hypoxia‐treated, LDHA NC or KD SW480 cells identified by RNA‐seq (n = 3/group). B) The top 10 KEGG enrichment pathways of differentially expressed mRNA. The red character‐labeled pathways involve FASN. C) FASN expression levels in hypoxia‐treated CRC cells (LDHA NC vs KD; or LDHA NC vs OEX). Data are presented as −ΔΔCt (t‐test, n = 3/group). D) FASN expression in hypoxia‐treated CRC cell lines (EBV‐miR‐BART18‐3p NC vs KD; or EBV‐miR‐BART18‐3p NC vs OEX). Data are presented as −ΔΔCt (t‐test, n = 3/group). E) Western blot of FASN protein levels in hypoxia‐treated CRC cells (LDHA NC vs KD; LDHA NC vs OEX; EBV‐miR‐BART18‐3p NC vs KD; and EBV‐miR‐BART18‐3p NC vs OEX). F) Quantifications of western blot results (t‐test, three technical replicates each). G) Representative images of FASN expression in TMAs. H) Immune reactivity scores (IRS) of FASN expression in TMAs. I) Kaplan–Meier curves showing the overall survival of CRC patients according to tumoral FASN levels in TMAs (log‐rank test). J) DNA pull‐down and western blot assays showing protein levels of H3K9ac, H3K14ac, H3K27ac in hypoxia‐treated CRC cells (EBV‐miR‐BART18‐3p NC vs KD; or EBV‐miR‐BART18‐3p NC vs OEX). H3 was used as the loading control. K) Quantifications of western blot results (t‐test, three technical replicates each). L) Quantification of the lipid contents in DLD‐1 cells (one‐way ANOVA, n = 3/group). M) Lipid contents were measured and quantified in hypoxia‐treated DLD‐1 cells (one‐way ANOVA, n = 3/group). n.s.: no significance, *P < 0.05, **P < 0.01, ***P < 0.001.
