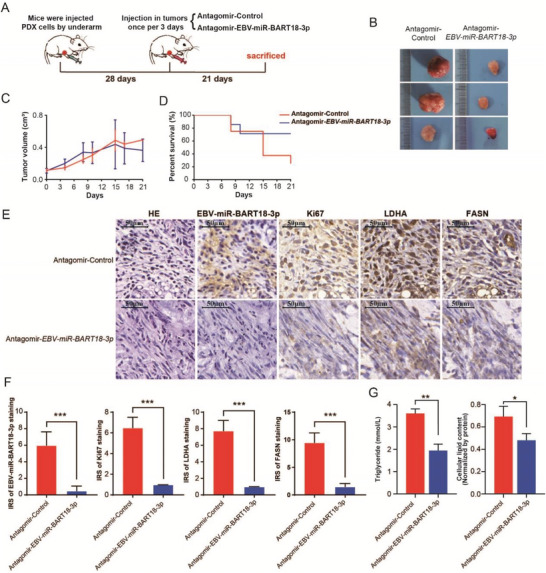
Figure 6.

Inhibition of EBV‐miR‐BART18‐3p ameliorates CRC progression in a PDX mouse model. A) Schematic diagram of the PDX‐antagomir experimental design. B) Representative tumor images in the PDX‐antagomir model. C) Tumor volumes after intratumoral antagomir injection. Error bar: SEM. D) Survival curves of mice after intratumoral antagomir injection. E) Representative images of PDX tumor serial sections subjected to H&E, EBV‐miR‐BART18‐3p, Ki67, LDHA, and FASN staining. F) Quantification of PDX tumor section staining (t‐test, n = 7/group). G) Lipid and triglyceride contents of PDX tumor tissues (t‐test, n = 7/group). n.s.: no significance, *P < 0.05, **P < 0.01, ***P < 0.001.
